
Quite often there are situations in which you are aware that deadlocks are happening in your SQL Server database, but you are lacking the information required to fix them.
What you need under these circumstances is an automated way of tracking the locks and logging them.
In this article, I demonstrate a simple way to set up lock monitoring for your database. The logs which are produced will show the exact SQL queries which were running at the time of each deadlock, providing you with the information you need in order to determine the root cause.
Deadlock example
So how do we recognise when our application has encountered a deadlock?
Transaction (Process ID 74) was deadlocked on lock resources with another process and has been chosen as the deadlock victim. Rerun the transaction.
This is the kind of error message you might expect to see when your application encounters a deadlock.
In very simple terms, a deadlock will occur if query ‘A’ is waiting for a particular resource that query ‘B’ is using, while at the same time query ‘B’ is waiting for a resource that query ‘A’ is currently holding on to. Eventually, a timeout will be reached. One of the queries will succeed and the other query will fail with a deadlock error.
The monitoring which we’ll configure below will help you to track down this kind of issue and will also allow you to see generally where there is contention/locking occurring in your database.
Setting things up
Before we begin, you’ll need an Edition of SQL Server which includes the SQL Server Agent, such as the Standard or Developer Edition. You’ll also need to have SQL Server Management Studio installed.
First of all, open up SQL Server Management Studio and connect to the database instance which you need to configure the logging for.
Note that I’m using version 18 of SQL Server Management Studio and I’m connecting to a SQL Server 2019 instance. However, the steps should be very similar for earlier versions.
After you have logged into your database instance, right-click on the ‘SQL Server Agent’ node, select ‘New’, then select ‘Job…’.
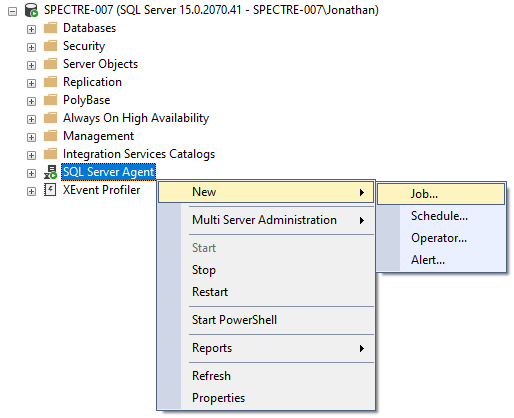
A ‘New Job’ dialog will appear.
The ‘General’ section of the dialog allows you to configure some basic settings for the Job.
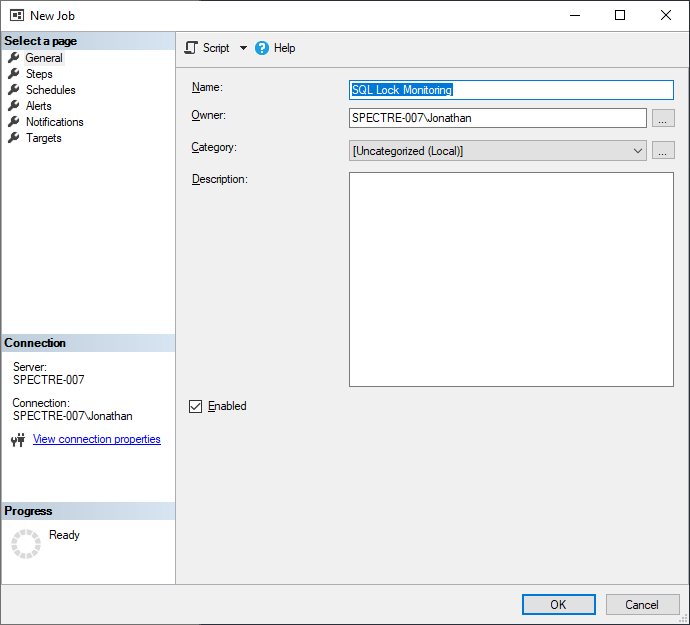
Enter a sensible name into the ‘Name’ field e.g. ‘SQL Lock Monitoring’. You can leave everything else at the default values unless there’s something in particular that you want to change.
Next, go to the ‘Steps’ section on the left-hand side and click the ‘New…’ button.
A ‘New Job Step’ dialog will open up.
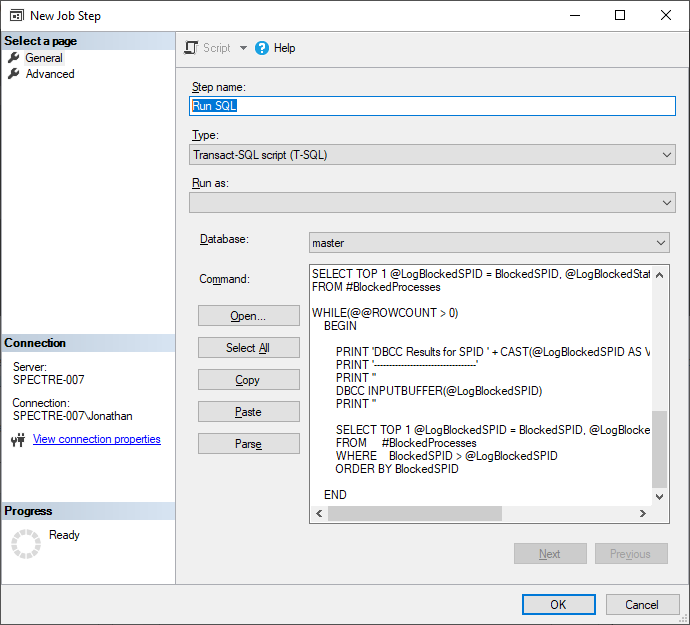
Enter a name into the ‘Step name’ field e.g. ‘Run SQL’.
Set the ‘Type’ to be ‘Transact-SQL script (T-SQL)’.
Leave ‘Run as’ empty.
The ‘Database’ should default to ‘master’.
Paste the following SQL into the ‘Command’ textbox.
-- Output any blocked/blocking processes.

SET NOCOUNT ON
GO

IF EXISTS (SELECT name
           FROM   tempdb..sysobjects
           WHERE  name = '#BlockedProcesses')
	DROP TABLE #BlockedProcesses
GO

CREATE TABLE #BlockedProcesses
(
    BlockedSPID   INT,
    BlockedStatus CHAR(10)
)
GO

INSERT INTO #BlockedProcesses
	SELECT DISTINCT spid, 'BLOCKED'
	FROM   master..sysprocesses
	WHERE  blocked <> 0
UNION
	SELECT DISTINCT blocked, 'BLOCKING'
	FROM   master..sysprocesses
	WHERE  blocked <> 0

DECLARE @LogBlockedSPID   INT
DECLARE @LogBlockedStatus CHAR(10)

SELECT TOP 1 @LogBlockedSPID = BlockedSPID, @LogBlockedStatus = BlockedStatus
FROM #BlockedProcesses

WHILE(@@ROWCOUNT > 0)
    BEGIN

        PRINT 'DBCC Results for SPID ' + CAST(@LogBlockedSPID AS VARCHAR(5)) + ' (' + RTRIM(@LogBlockedStatus) + ')'
        PRINT '----------------------------------'
        PRINT ''
        DBCC INPUTBUFFER(@LogBlockedSPID)
	PRINT ''

        SELECT TOP 1 @LogBlockedSPID = BlockedSPID, @LogBlockedStatus = BlockedStatus
        FROM     #BlockedProcesses
        WHERE    BlockedSPID > @LogBlockedSPID
        ORDER BY BlockedSPID

    END
The SQL creates a temporary table and inserts the details of all SQL Server processes which are currently blocked into it. The details of each blocked process are then selected and printed. When we’ve completed the setup, our Job will capture the output of the PRINT command and log it to a file.
Moving on, within the same ‘New Job Step’ dialog, go to the ‘Advanced’ tab.
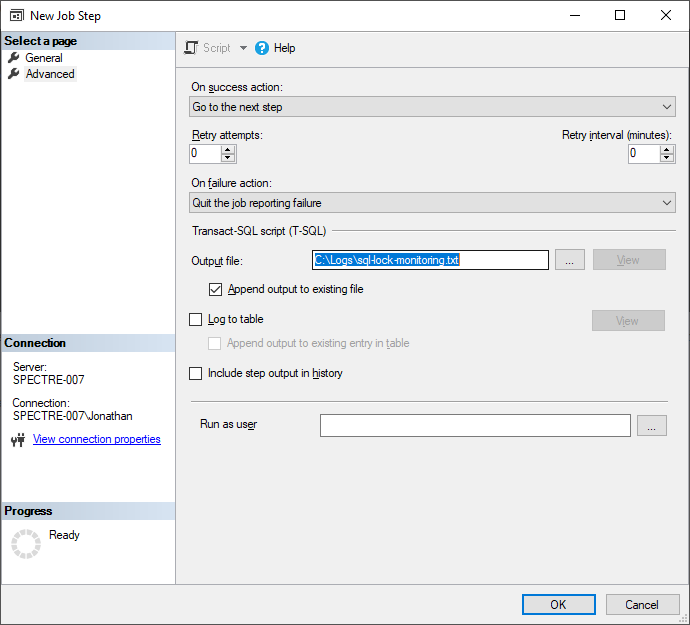
Choose an ‘Output file’ location and select the ‘Append output to existing file’ option.
Everything else can be left as default e.g. ‘Run as user’ can be left empty etc.
Click ‘OK’.
Back on the ‘New Job’ dialog go to the ‘Schedules’ section and click on the ‘New…’ button.
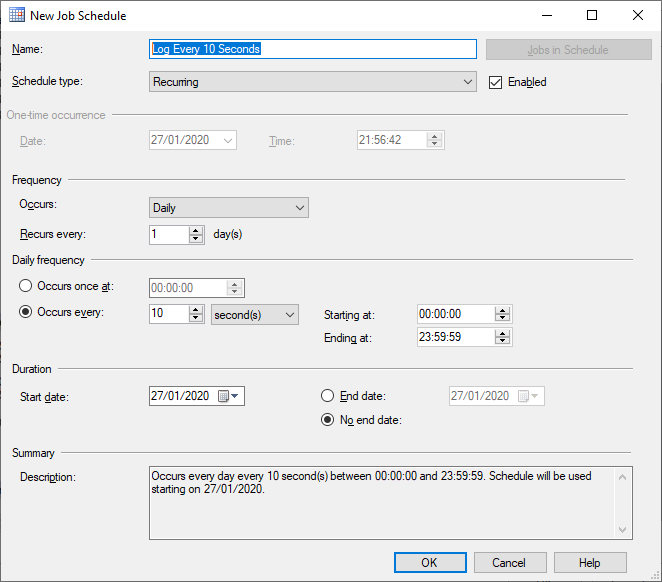
Enter a name into the ‘Name’ field e.g. ‘Log Every 10 Seconds’.
Leave the ‘Schedule type’ as ‘Recurring’.
Under the ‘Frequency’ heading, set ‘Occurs’ to ‘Daily’.
Under the ‘Daily frequency’ heading, change the ‘Occurs every’ value to ’10’ and set the interval combo-box to ‘second(s)’.
If desired, you can also configure the ‘Starting at’ and ‘Ending at’ fields to match the period during which the database is active. This will help to minimise the size of the log files.
Click ‘OK’.
Lastly, back on the ‘New Job’ dialog, click ‘OK’ again to complete the Job setup.
Note that after completing the setup the Job will start immediately and will append its output to the specified log file every 10 seconds (you can adjust this to your desired frequency). Don’t forget to disable the Job whenever you are finished testing.
Output inspection
So what does the output of the Job look like?
You should expect to see entries that look similar to the example below in the log file which is generated.
Job 'SQL Lock Monitoring' : Step 1, 'Run SQL' : Began Executing 2019-06-29 08:58:40

Job 'SQL Lock Monitoring' : Step 1, 'Run SQL' : Began Executing 2019-06-29 08:58:51

Job 'SQL Lock Monitoring' : Step 1, 'Run SQL' : Began Executing 2019-06-29 08:59:00

Job 'SQL Lock Monitoring' : Step 1, 'Run SQL' : Began Executing 2019-06-29 08:59:10

Job 'SQL Lock Monitoring' : Step 1, 'Run SQL' : Began Executing 2019-06-29 08:59:20

Job 'SQL Lock Monitoring' : Step 1, 'Run SQL' : Began Executing 2019-06-29 08:59:30

DBCC Results for SPID 55 (BLOCKED) [SQLSTATE 01000]
---------------------------------- [SQLSTATE 01000]
EventType Parameters EventInfo
--------- ---------- -----------------------------
RPC Event 0 sys.sp_MSenumchangesdirect;1
DBCC execution completed. If DBCC printed error messages, contact your system administrator. [SQLSTATE 01000]
DBCC Results for SPID 57 (BLOCKED) [SQLSTATE 01000]
---------------------------------- [SQLSTATE 01000]
EventType Parameters EventInfo
--------- ---------- -----------------------------
RPC Event 0 sys.sp_MSenumchangesdirect;1
DBCC execution completed. If DBCC printed error messages, contact your system administrator. [SQLSTATE 01000]
DBCC Results for SPID 75 (BLOCKING) [SQLSTATE 01000]
---------------------------------- [SQLSTATE 01000]
EventType Parameters EventInfo
-------------- ---------- --------------------------------------------------------------------------------------------------------------------------------------------
Language Event 0 (@Balance float)UPDATE Accounts SET Balance = @Balance WHERE ID = 234 SELECT SCOPE_IDENTITY() AS NEWID
DBCC execution completed. If DBCC printed error messages, contact your system administrator. [SQLSTATE 01000]
DBCC Results for SPID 116 (BLOCKED) [SQLSTATE 01000]
---------------------------------- [SQLSTATE 01000]
EventType Parameters EventInfo
--------- ---------- --------------------------
RPC Event 0 sys.sp_MSmakegeneration;1
DBCC execution completed. If DBCC printed error messages, contact your system administrator. [SQLSTATE 01000]
DBCC Results for SPID 119 (BLOCKED) [SQLSTATE 01000]
---------------------------------- [SQLSTATE 01000]
EventType Parameters EventInfo
--------- ---------- --------------------------
RPC Event 0 sys.sp_MSsetlastsentgen;1
DBCC execution completed. If DBCC printed error messages, contact your system administrator. [SQLSTATE 01000]
The logging is minimal until blocked processes are encountered. However, whenever blocked processes are detected, the output provides lots of detail in regards to what is going on with locking in the database.
Note that the output displays whatever locks were ongoing at the time of the Job execution and not all locks will result in a deadlock. Therefore, you’ll need to correlate the output with your own application logs. It is usually best to gather deadlock exception timestamps from your application logs and then see what locks were happening at the same time to see which queries actually caused the deadlock.
We can see in the above example (from the emboldened text) that the sys.sp_MSenumchangesdirect stored procedure call is blocking the UPDATE Accounts SET Balance... SQL query.
Being able to see the stored procedure name and the actual SQL query text for both the blocking process and the blocked process is very useful for determining the root cause.
Unfortunately, empty PRINT commands are ignored when outputting to a log file, however, this is a minor inconvenience given the insight we are able to obtain from the logs.
Wrapping up
I trust that you will find the monitoring Job useful and that it will help you to identify and fix any deadlock errors you’ve been encountering.
It is much simpler than some of the alternative approaches which involve more complex procedures such as turning on trace flags and running the Profiler or using Extended Events.
If you need to roll this out across more than one server, the ‘Script Job as’ feature within SQL Server Management Studio will allow you to create a SQL script that can be used to recreate it elsewhere. Don’t forget to update the @owner_login_name and @output_file_name within the generated SQL script before executing it.
You can find the SQL from this blog post on my SQL Server Scripts GitHub repository.


Comments