You’ve had enough.
Yes, you’ve finally decided that this is the last time you’ll use a Console.WriteLine method call to troubleshoot one of your Blazor WebAssembly components because you can’t get any debug breakpoints to hit!
Debugging is an essential part of software development and when it doesn’t work, it can be frustrating. This is especially true when you’re working with a framework as innovative as Blazor where you would expect that things should “just work”.
Thankfully, in the majority of cases, debugging problems can be fixed fairly easily. I will share the most common problems and solutions in this article.
Problems/Solutions
In the following subsections, I will cover the most common reasons for Blazor WebAssembly debugging problems and their corresponding solutions. Let’s see if we can remedy those pesky debugging issues once and for all!
Invalid debugging configuration
The first thing I recommend checking is the debugging configuration for your project, as the launch settings may be misconfigured, preventing the debugger from attaching correctly. I’m starting with this one, as it’s an issue I came across recently with an existing Blazor WebAssembly project. Without the correct configuration, debugging will definitely not work!
Blazor projects include a ‘launchSettings.json’ file which is located within a ‘Properties’ folder inside the project. Naturally, this file contains settings related to how the project is launched and debugged. The ‘launchSettings.json’ file should include an “inspectUri” setting.
The “inspectUri” setting is a URL template that allows the browser to connect to a debug proxy, enabling the debugging of .NET code within the browser Developer Tools. In other words, the proxy links the browser’s JavaScript debugging interface with the .NET debugging infrastructure.
If your ‘launchSettings.json’ file is missing the “inspectUri” setting this will explain why debugging isn’t working for you.
Solution
To resolve the problem, you’ll need to open your ‘launchSettings.json’ file (within the ‘Properties’ folder of your Blazor project) and add the following line to it (the exact location to add this line within the file is shown further below).
"inspectUri": "{wsProtocol}://{url.hostname}:{url.port}/_framework/debug/ws-proxy?browser={browserInspectUri}"
The placeholder values such as {wsProtocol} and {url.hostname} will be replaced at runtime with appropriate values by your application host. ws-proxy is the NodeJS debug proxy that Blazor sets up when running in Debug mode. The {browserInspectUri} placeholder will be replaced with a special URL that the browser Developer Tools use for connecting to the debugger.
For a Standalone Blazor WebAssembly project, you will only have one ‘launchSettings.json’ file which will be located within the ‘Properties’ folder of the main project in your solution.
For an ASP.NET Core Hosted Blazor WebAssembly project, you will usually find a ‘launchSettings.json’ file in both the Blazor WebAssembly ‘Client’ project, as well as the ‘Server’ (API) project. In this case, it is the ‘launchSettings.json’ file within the Server project that needs to have the “inspectUri” setting in place; it doesn’t matter if the setting is present in the Client project.
It is also important that you include an “inspectUri” setting within each debugging ‘profile’. The full contents of a typical ‘launchSettings.json’ file have been included below for clarity.
{
  "iisSettings": {
    "windowsAuthentication": false,
    "anonymousAuthentication": true,
    "iisExpress": {
      "applicationUrl": "http://localhost:36277",
      "sslPort": 44387
    }
  },
  "profiles": {
    "BlazorDemo.Server": {
      "commandName": "Project",
      "dotnetRunMessages": true,
      "launchBrowser": true,
      "inspectUri": "{wsProtocol}://{url.hostname}:{url.port}/_framework/debug/ws-proxy?browser={browserInspectUri}",
      "applicationUrl": "https://localhost:7238;http://localhost:5176",
      "environmentVariables": {
        "ASPNETCORE_ENVIRONMENT": "Development"
      }
    },
    "IIS Express": {
      "commandName": "IISExpress",
      "launchBrowser": true,
      "inspectUri": "{wsProtocol}://{url.hostname}:{url.port}/_framework/debug/ws-proxy?browser={browserInspectUri}",
      "environmentVariables": {
        "ASPNETCORE_ENVIRONMENT": "Development"
      }
    }
  }
}
One last thing to note is that the “inspectUri” setting will be ignored when in Release mode, as the debugging proxy will not be running. Therefore, you don’t need to be concerned about including the “inspectUri” setting on a conditional basis. You can leave it in there and it will not have any adverse effects on security or performance.
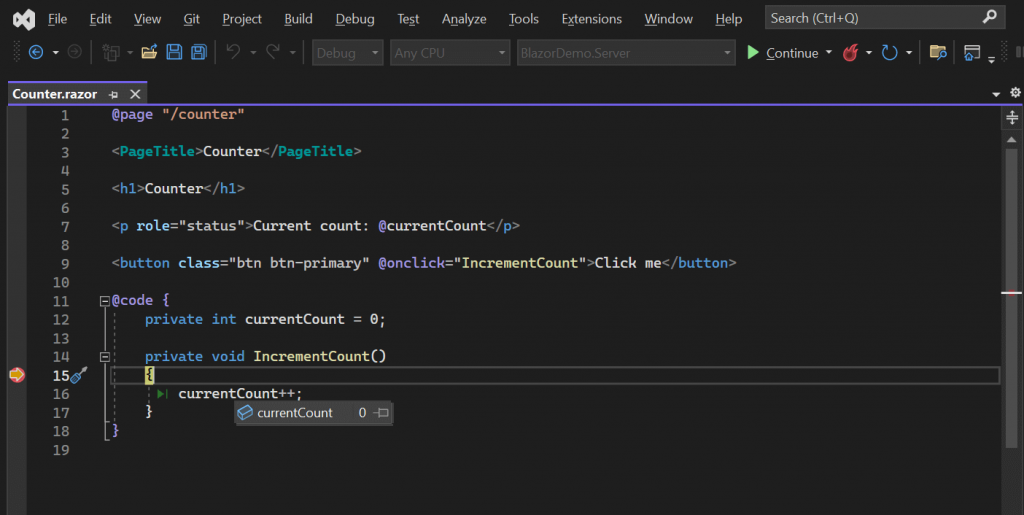
Ideally, in most cases, the missing “inspectUri” setting will be the source of your problem and after adding it you should find that your breakpoints are being hit, as per the screenshot below.

Incompatible browser
Another potential reason for debugging not working is an incompatible browser.
While modern browsers offer extensive debugging capabilities for WebAssembly and support modern protocols like WebSockets (which is required for Blazor debugging) not every browser is created equal. Sorry, Internet Explorer isn’t going to cut it!
Solution
Ensure that you are using a browser that is known to support Blazor WebAssembly debugging. A Chromium-based browser is currently required, so the latest versions of Google Chrome and Microsoft Edge are solid bets. However, I recommend that you keep an eye on the official Blazor documentation for up-to-date browser compatibility information.
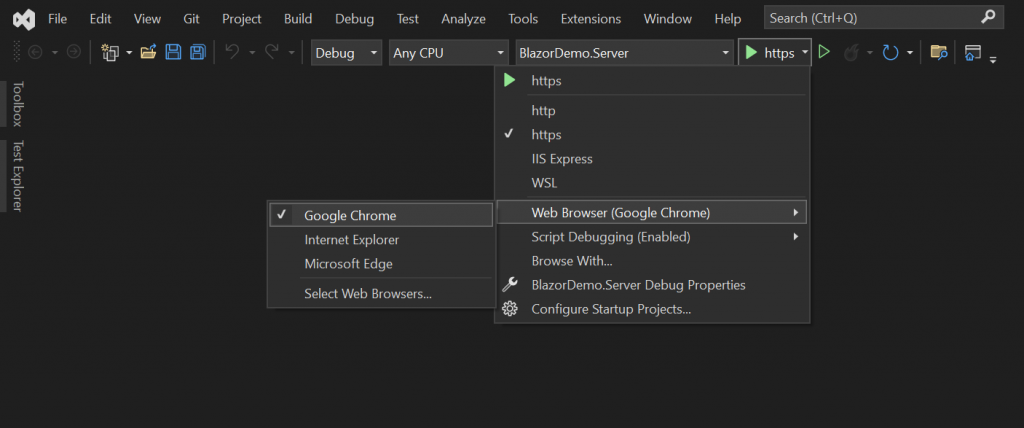
If you are using Visual Studio, after installing a new browser or updating a browser to the latest version, make sure you have selected the correct ‘Web Browser’ from the Debug drop-down menu, as shown below.

Brower extension interference
Continuing with the theme of browser issues, browser extensions, especially those related to development and debugging, can on occasion conflict with the Blazor debugging experience.
Usually, this isn’t an issue since the browser window launched from Visual Studio should already have extensions disabled, however, it is still worth double-checking.
Solution
After you start debugging, try opening a new ‘Incognito’ or ‘InPrivate’ window and paste the localhost URL of your application into the Incognito/InPrivate window address bar, then check if your breakpoints are being hit.
Alternatively, you can disable extensions in your chosen browser temporarily. If you are using Chrome or Edge, click on the ‘three dots’ at the top-right of the browser window, then go to Extensions –> Manage Extensions and disable each extension. If this works, I recommend that you then enable your extensions one by one to identify the culprit.
Outdated development environment
Sometimes, the problem isn’t with your Blazor project configuration or the browser but with your development environment.
If your .NET SDK or Runtime is outdated, it may lack the necessary tools or improvements that are required for a seamless Blazor debugging experience.
Additionally, if your IDE or editor of choice is not up to date you may encounter difficulties.
Solution
Update to the latest .NET SDK and Runtime version by downloading the relevant installers from the .NET SDKs download page. This not only aids debugging but often brings performance improvements and new features.
Ensure that your IDE (e.g. Visual Studio) has been updated to the latest version (often updates for your IDE will include new SDKs and Runtime versions). If you’re using Visual Studio Code, ensure that the C# extension and any related debugging extensions are up to date.
Currently, the following IDE/editors support Blazor WebAssembly debugging.
- Visual Studio
- Visual Studio for Mac
- Visual Studio Code
Other issues
If you’ve made it this far and nothing has worked, there may be something more fundamentally wrong.
Perhaps there is a firewall issue blocking the NodeJS debug proxy or the linker that trims unused code is stripping out code that is essential for debugging.
I recommend checking out this Troubleshoot section within the Microsoft Docs for other ideas if you’re still having trouble.
Detaching
While the solutions covered in this article should include the most common culprits in relation to why you can’t debug your Blazor WebAssembly application, the nuances of individual projects can sometimes introduce unique challenges. However, as mentioned in the introduction, the cause is usually something simple. If debugging isn’t working for you after trying all of the suggested solutions, remember to stay patient and methodical in your approach to resolving the problem.
The Blazor community is vibrant and continually evolving, so the chances are that someone else has faced and solved the same issue you’ve been grappling with. If you can’t find a resolution after reading this article and reviewing the latest official documentation please feel free to post a comment and I will do my best to help!


Comments