
Have you ever found yourself spending countless hours creating the perfect diagram?
For software diagrams that are intended to document the flow and interactions between different components, a lot of time usually needs to be spent understanding what the existing code is doing, and then, yet more time needs to be spent manually creating all the diagram elements and connecting them with lines and arrows, etc.
There are many nice visual diagramming tools available these days, such as draw.io. However, even with the intuitive drag-and-drop interfaces that such tools provide, creating all the various aspects of the diagram and aligning them perfectly still requires a lot of effort to achieve a visually appealing result.
What if there was a better way? One that didn’t require lots of clicking, dragging, and resizing?
This is where markdown-inspired diagram tools like Mermaid come in, offering a text-based approach to generating diagrams and charts using a simple syntax, while displaying them beautifully via a JavaScript rendering engine.
Mermaid diagrams have enjoyed widespread adoption, and support for editing and rendering them within editors and IDEs continues to expand. The latest versions of Visual Studio (as of September 16, 2025) have added Mermaid chart rendering, increasing the appeal for .NET developers, especially. Additionally, the rise of AI-powered coding assistants such as GitHub Copilot makes the generation of text-based diagrams even more accessible.
In this post, I will provide you with an introduction to Mermaid diagrams, showing how to create your first diagram and how to use GitHub Copilot within Visual Studio to generate diagrams that are relevant to your codebase.
Creating your first diagram
Let’s begin by creating a sample diagram so that we can start learning how the Mermaid syntax works.
First of all, head over to mermaid.live to load the official Mermaid Live Editor online interface.
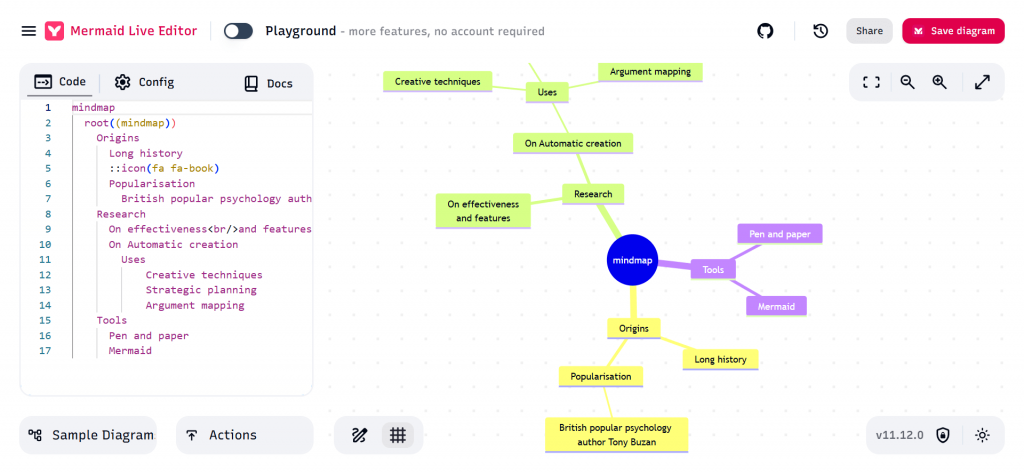
When you load the Mermaid Live Editor, a sample diagram is displayed.
The code used to generate the diagram is displayed on the left-hand side of the page, and a live preview of the rendered diagram is shown on the right.
You can see from the above screenshot that the first line of code defines the type of diagram, in this case, a mindmap. For a Mindmap diagram, a root node must be defined, then each level of the Mindmap is indented by 2 spaces. That’s really all there is to create a simple Mindmap diagram!
The rendering engine does an excellent job of making the diagram look visually appealing and automatically assigns a unique colour to each level of the Mindmap. By default, the theme is set to ‘default’, but this can easily be changed within the ‘config’ tab.
Experimenting
At this point, I recommend experimenting with the sample Mindmap diagram, editing and adding node labels, and creating new branches and levels to get familiar with things and understand what’s possible.
To get further help, you can click on the Docs link to view the documentation for the current type of diagram.
For example, the Mindmap documentation explains how to specify the shape of a Mindmap node. To make the ‘Tools’ node a hexagon, we can surround it with double curly braces, like this: {{Tools}}
Diagram types
While you’re on the Mermaid Live Editor page, I also recommend trying out the different types of diagrams. There is an impressive list of diagram types available, including Flowchart, Sequence, Gantt, etc.
You can get started quickly with each of the diagram types by clicking on one of the options within the ‘Sample Diagrams’ section on the left-hand side of the interface.
For example, below is the sample Class diagram.
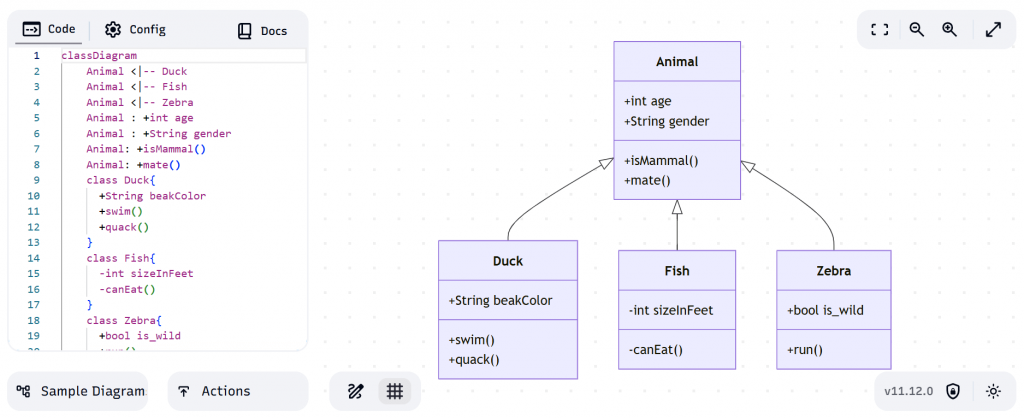
As you can see from the screenshot above, the Class diagram has its own unique syntax. However, it’s quite straightforward to read, and a relatively small amount of code is required to achieve the result. It’s also pretty clear how we could extend this diagram with additional classes, without needing to dig too much into the documentation.
Visual Studio preview
At this point, I hope you’re convinced that Mermaid diagrams are worth exploring further and agree that it’s impressive what can be achieved with a small amount of text/code.
Next, let’s take a look at how we can avail of the recent Visual Studio feature that allows Mermaid diagrams to be previewed.
The quickest way to test the feature out is to copy the code from one of the sample Mermaid diagrams created via the Mermaid Live Editor into a new file, using your favourite text editor (or directly within Visual Studio) and then save the file with the Markdown (.md) extension.
The only other thing you need to do is add the following line to the start of the file…
```mermaid
… and add the following line to the end of the file.
```
This will allow editors, such as Visual Studio, to understand that the Markdown file is, in fact, a Mermaid diagram and that it can be rendered as such.
As an example, this is the full contents of the Markdown file for the sample Mindmap diagram from the Mermaid Live Editor.
```mermaid
mindmap
  root((mindmap))
    Origins
      Long history
      ::icon(fa fa-book)
      Popularisation
        British popular psychology author Tony Buzan
    Research
      On effectiveness<br/>and features
      On Automatic creation
        Uses
            Creative techniques
            Strategic planning
            Argument mapping
    Tools
      Pen and paper
      Mermaid
```
After opening the file in Visual Studio, the result should look similar to the screenshot below.
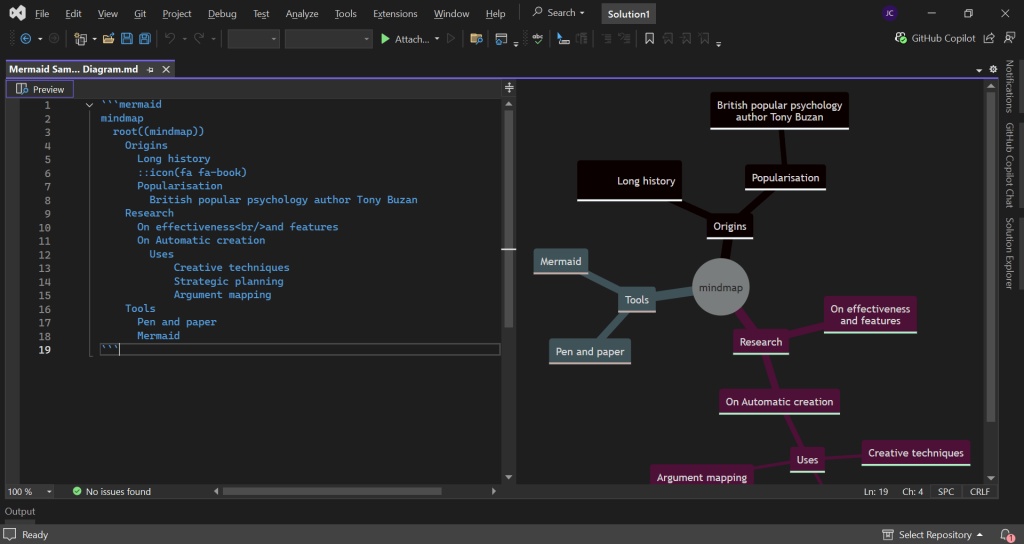
The preview can be toggled on or off using the ‘Preview’ button at the top-left of the current file editor. As you can see, the diagram renders nicely, albeit with a different theme to the default theme used on the Mermaid Live Editor.
Within Visual Studio, you can edit the diagram and see the results rendered live within the preview. This is a very useful feature and allows you to stay within your IDE for greater productivity.
GitHub Copilot
The capability of GitHub Copilot to create and edit Mermaid diagrams is where we can start to see the real power of diagram tools that use a text-based format, which is well understood by AI tools.
Using the GitHub Copilot integration within Visual Studio, not only can you learn how to create ad-hoc diagrams such as Mindmaps and Kanban boards, but you can also use this integration to create highly complex diagrams that would take some time and understanding to develop, even with the simpler text-based diagram format.
If you’re new to using GitHub Copilot in Visual Studio, I encourage you to check out my Getting started with GitHub Copilot in Visual Studio blog post before continuing.
Starting simple
Let’s start simple and ask GitHub Copilot to create a sample Mindmap diagram for us.
Assuming we use a generic prompt as follows within the GitHub Copilot Chat Window…
Can you generate a sample Mindmap using the Mermaid diagram format?
GitHub Copilot will generate something simple for us, such as the following.
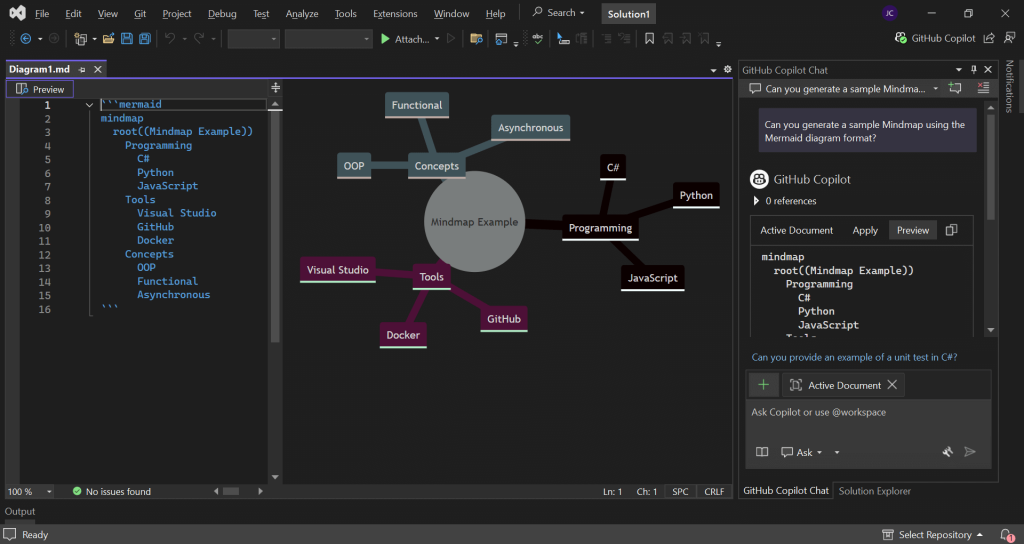
You can see from the screenshot above that I’ve scrolled back up within the GitHub Copilot Chat Window and pressed the ‘Preview’ button to display the diagram code and preview within its own file editor in Visual Studio. This is a very useful feature and allows us to quickly start editing the diagram and save it as required.
Getting more complex
Now for something a bit more complex.
For this, I’m going to open the eShop Reference Application in Visual Studio, which you can clone if you are looking for a project to experiment with.
Next, within the GitHub Copilot Chat Window, let’s write the following prompt.
Can you generate a highly detailed Mermaid Sequence diagram that documents the flow of what happens when a request is made to the POST /items endpoint within Catalog.API?
This will result in something similar to the following being generated.
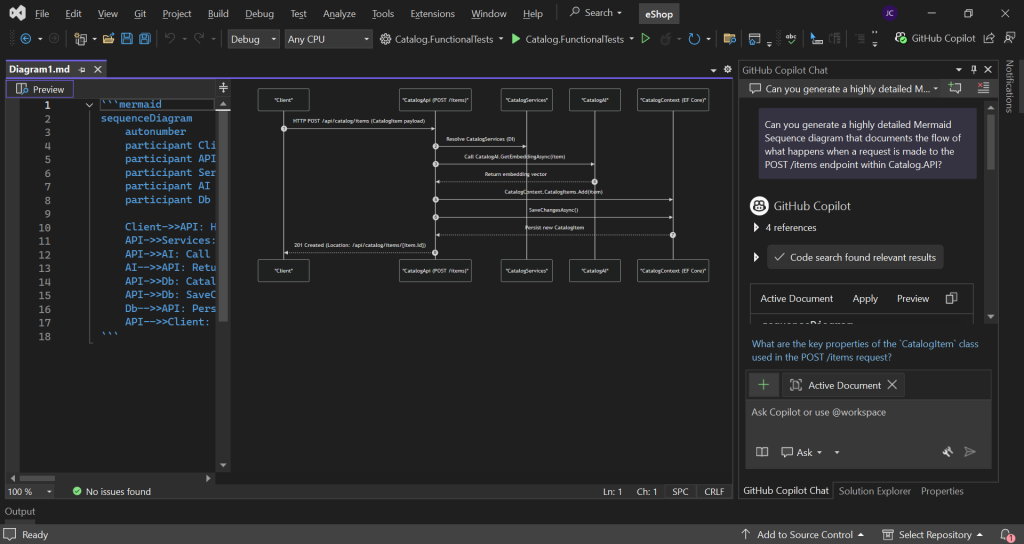
The diagram that has been generated allows us to see at a glance the main components that are involved when a request is made to post items via the Catalog API. Additionally, the diagram provides some useful insight into the main classes and methods that are used and called as part of the processing.
Of course, after the first version of the diagram has been generated, we can provide feedback to GitHub Copilot, asking for elements to be added or removed from the diagram, depending on the level of complexity that is desired.
Further experimentation
Now, let’s experiment a little bit further and see what we can achieve with a small tweak to the prompt.
Can you generate a highly detailed Mermaid Flowchart diagram that documents the flow of what happens when a request is made to the POST /items endpoint within Catalog.API?
In this case, I’ve simply changed the word ‘Sequence’ to ‘Flowchart’. This will result in something similar to the following being generated.
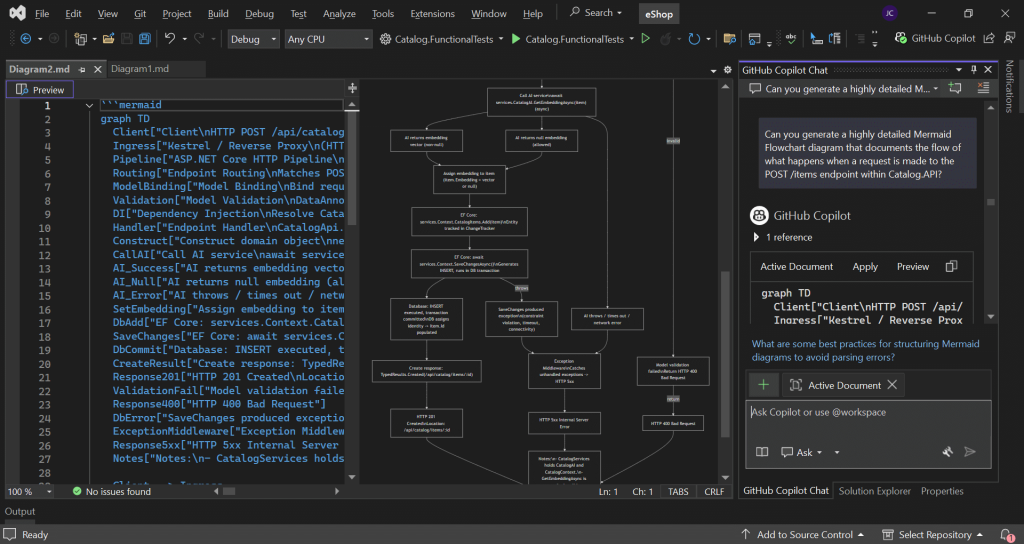
In this case, a very detailed flowchart has been generated. In some cases, this could be viewed as a better way of visualising the flow of interactions and is an interesting alternative to the Sequence diagram.
Note that sometimes GitHub Copilot will include invalid/unsupported characters that result in Mermaid parsing/rendering issues. In these cases, you can paste the error that is displayed within the preview window into the GitHub Copilot Chat Window and ask GitHub Copilot to fix these issues.
It’s impressive how detailed and accurate many of the diagrams produced by GitHub Copilot are. However, as with all AI responses, it’s important to check the results carefully, especially if you are using the diagrams to document critical parts of the system for long-term reference.
Nonetheless, the time that can be saved by leveraging both the Mermaid diagram format along with the productivity gains of generating and editing these within Visual Studio using GitHub Copilot can be quite considerable.
Summary
In this post, I have provided an introduction to Mermaid diagrams and how you can leverage GitHub Copilot within Visual Studio to create these diagrams for you.
I started by making you aware of the official Mermaid Live Editor and how to use this interface to generate and edit sample diagrams of different types.
I then demonstrated how you can edit and preview Mermaid diagrams directly within Visual Studio.
Lastly, I provided some examples of using GitHub Copilot to create diagrams that are specific to your codebase, to help with understanding the flow and interactions between components.
I hope that you found the information in this post useful, and please let me know in the comments what your thoughts are on Mermaid diagrams and if there are any unique use cases you’ve found for them.


Comments