
From time to time it can be very useful to debug applications running on remote machines. This is particularly true when the machine you are debugging your code on features specialised built-in hardware devices, or when your application is behaving differently compared to when it is running on your development machine.
Many developers know that it is possible to configure remote debugging for Visual Studio, however, a lot of developers have never set it up personally.
Remote debugging can be a great time saver and often provides much greater insight into what your code is doing compared to other methods such as alert messages or logging.
In this article, I will show you how to set up remote debugging for Visual Studio and take you through all of the required steps one by one with screenshots for reference.
Setup
Setting up Remote Debugging for Visual Studio is actually a very straightforward process.
There are a couple of different ways to do it and I will be covering the simplest of these in the sub-sections below.
Locating the Remote Debugger
The first step is to locate the Remote Debugger directory on your development machine.
The location of the Remote Debugger will vary depending on your version of Visual Studio.
If you’re using Visual Studio 2019, for example, the Remote Debugger can be found at the following location (assuming your system drive letter is C and you are running a 64-bit version of Windows).
C:\Program Files (x86)\Microsoft Visual Studio\2019\Community\Common7\IDE\Remote Debugger
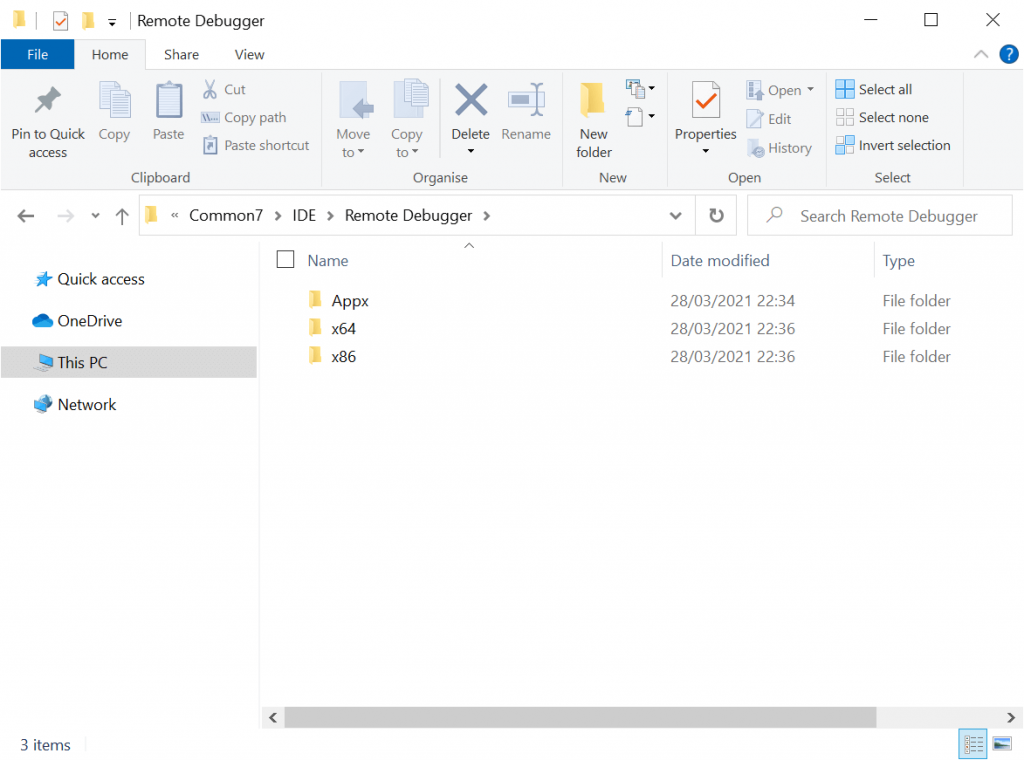
At this location, you will find three folders, as follows.
- Appx
- x64
- x86
See the screenshot below for reference.
Now you need to determine which version of the Remote Debugger you need.
If you’re debugging a 32-bit application you can use the ‘x86’ folder, otherwise, choose the ‘x64’ folder.
Deploying the Remote Debugger
After determining the folder you need, copy it to the machine that you need to connect to.
I normally create a ‘Remote Debugger’ folder somewhere on the remote machine and then copy the ‘x86’ or ‘x64’ folder into this.
Note that as an alternative to the ‘copy’ approach you can instead share your ‘Remote Debugger’ directory. However, I find that it is simpler to copy the necessary files to avoid the need to manage any credentials for the development machine on the remote machine.
Launching the Remote Debugger
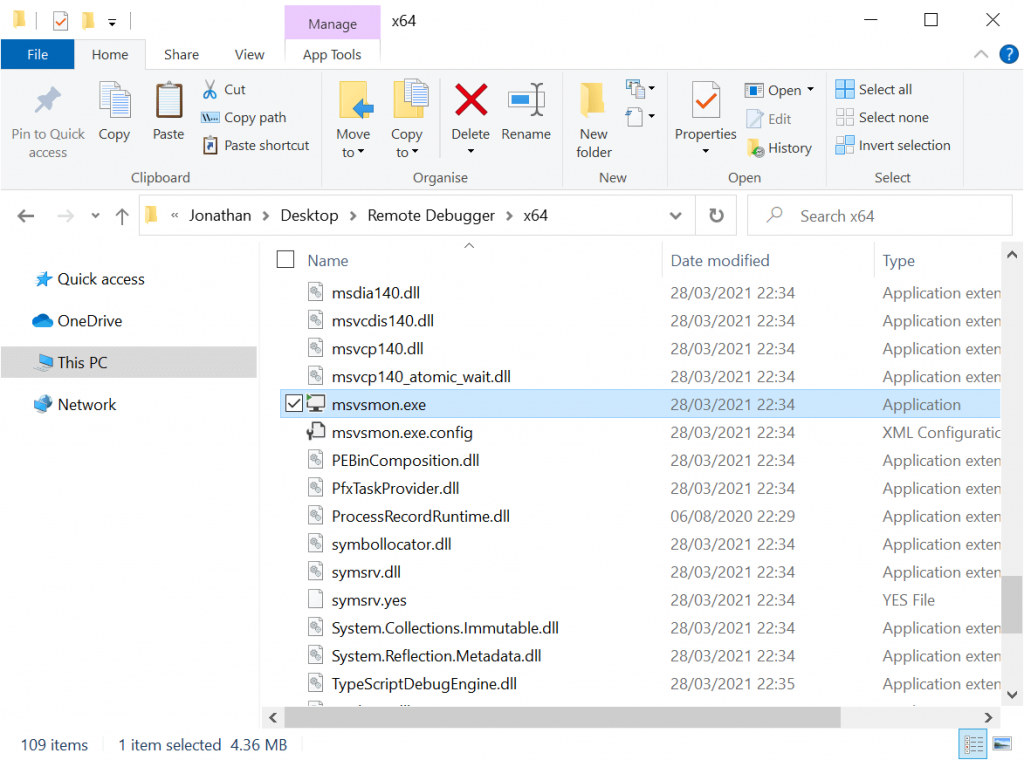
After copying over the Remote Debugger folder, on the remote machine you need to locate the Remote Debugger program and launch it.
The Remote Debugger program is named ‘msvsmon.exe’ and is highlighted in the screenshot below.
After launching the Remote Debugger for the first time, you will receive a Remote Debugging Configuration prompt, as per the screenshot below.
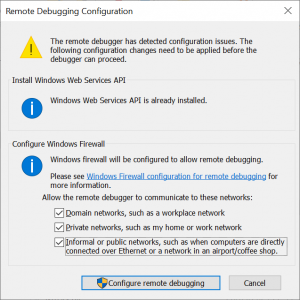
Adjust the Windows Firewall checkboxes where required and click on the ‘Configure remote debugging’ button to continue.
After the Remote Debugger loads, you’ll see a window appear as follows.
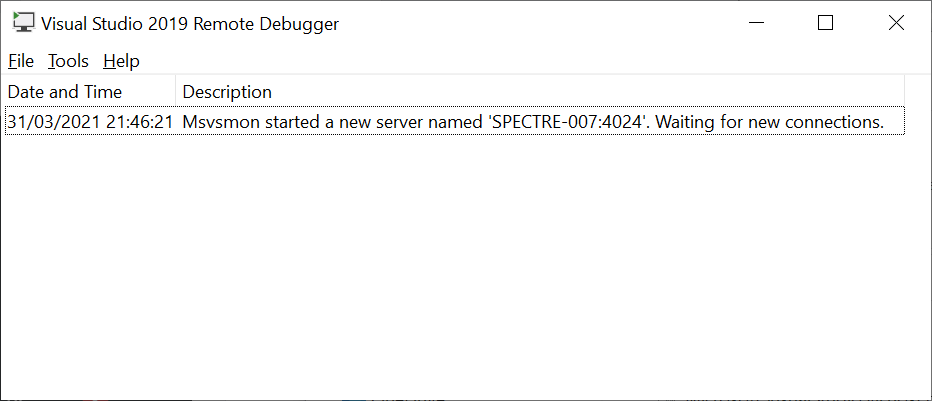
The Remote Debugger is now waiting for incoming connections from Visual Studio.
Preparing to remote debug
Before proceeding further, build a Debug version of your application and then copy the ‘Debug’ folder from within your ‘bin’ folder to the remote machine.
After launching the application on the remote machine you are now ready to remote debug.
Back on your development machine, make sure you have opened the solution containing the source code for the project you need to debug and set the appropriate breakpoints.
Note that the source code on the development machine must match the code deployed to the remote machine exactly, otherwise the breakpoints will not work.
Connecting to the Remote Debugger
From the toolbar at the top of Visual Studio select Debug –> Attach to Process…
This will launch the ‘Attach to Process’ dialog, as per the screenshot below.
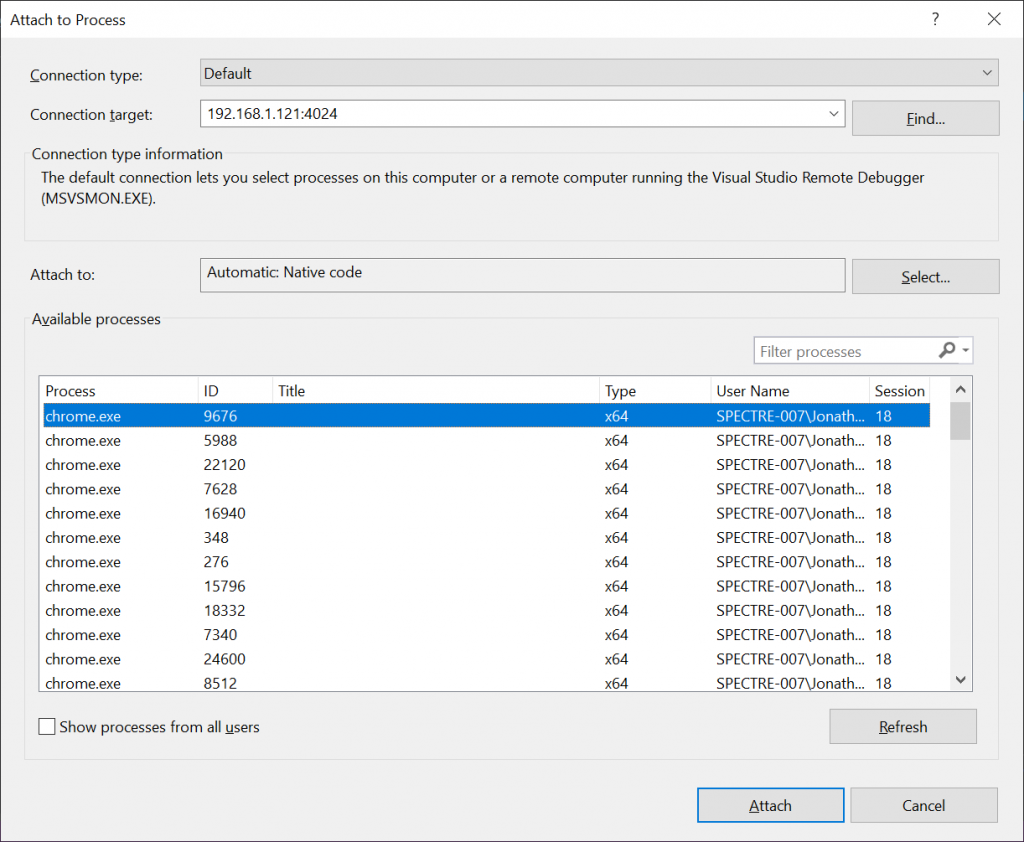
Update the ‘Connection target’ field to match the server name and port number shown within the Remote Debugger on the remote machine and press the Enter/Return key to confirm.
The first time you do this you will be prompted with a Windows Security Alert, as per the screenshot below.
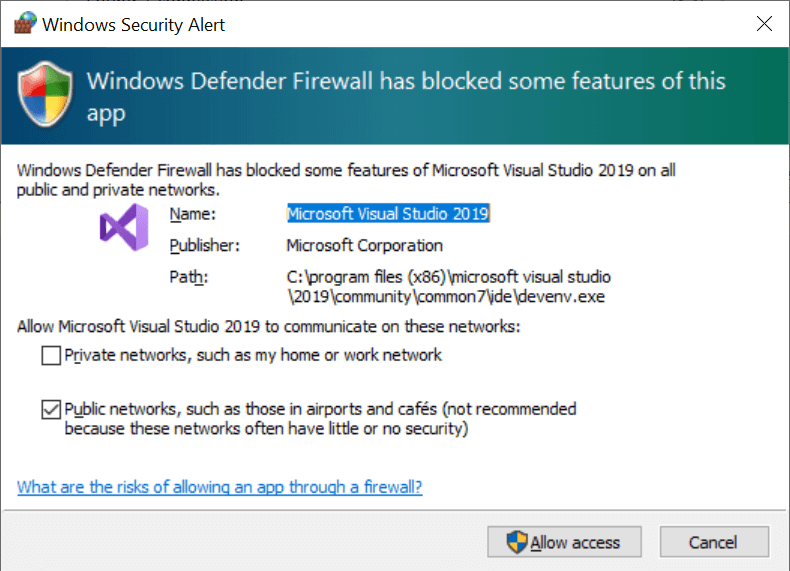
Update the checkboxes as required and click the ‘Allow access’ button to proceed.
You’ll also be prompted for the credentials needed to access resources on the remote machine.
The last thing you need to do is find the process you wish to connect to within the ‘Available processes’ list, select it, then press the ‘Attach’ button.
Within a few seconds, Visual Studio should have established a connection to the Remote Debugger on the remote machine and you can begin debugging.
Any breakpoints which you set within Visual Studio should now be hit and you can step through your code as if it were running on your local machine. Pretty cool, right?
Disconnecting…
In this article, I have walked through the process of setting up Remote Debugging for Visual Studio.
I’ve specifically covered how the setup procedure should be carried out for Visual Studio 2019, however, the steps are very similar for previous Visual Studio versions.
In closing, I hope that you found the steps laid out within this article straightforward to follow along with and that they helped you get up and running quickly with remote debugging for Visual Studio.
Comments
Aishwarya Shetty
Before proceeding further, build a Debug version of your application and then copy the ‘Debug’ folder from within your ‘bin’ folder to the remote machine.
After launching the application on the remote machine you are now ready to remote debug.
Im unable to perform this step. Not able to find my bin folder and debug folder. I’m using Visual Studio 2017
April 12, 2022Jonathan Crozier
Hi there, the easiest way to locate the ‘bin’ folder is to right-click on your project in Visual Studio and then select the ‘Open Folder in File Explorer’ option from the context menu.
April 12, 2022Heather
Thank you for the article. When I select msvsmon.exe at the process to attach, Visual Studio doesn’t actually deploy my Windows UWP app (MAUI) onto the remote device, so even though it is gone in debug mode, there is nothing to debug. Any idea what I could be doing wrong?
June 1, 2023Jonathan Crozier
Hi Heather, thanks for the comment 🙂
You need to copy a Debug version of your application to the remote device and launch your application on the remote device before you can attach to its process from Visual Studio. Please review the ‘Preparing to remote debug’ section of this article again for more details.
I hope that helps and please let me know if I’ve misunderstood the problem!
June 1, 2023