

Application Insights is a powerful Azure feature for monitoring web applications. It collects a wide range of useful data that you can analyse either in real-time or by executing queries against logs at a later point in time.
The logs that are stored by Application Insights enable you to see how your web requests are performing, what kind of load your application is under, what errors have occurred, as well as any custom metrics that you may have enriched the logs with.
The Kusto Query Language (KQL) is used across various Azure cloud resource types, including Application Insights, to allow logs and other big data sets to be queried in an efficient manner.
In this article, I am going to focus on using KQL queries within Application Insights Logs to help you understand the behaviour of your application. I will walk you through some practical examples and cover the most common query operators that you’ll need to become familiar with to start using KQL effectively.
What is KQL?
The KQL I am referring to stands for Kusto Query Language.
Note that this is different to Kibana Query Language, a simple query language for filtering Elasticsearch results.
KQL is a feature-rich query language powered by the Kusto Engine that allows you to filter, sort, and aggregate data. It was built for the cloud and designed to play well with large data sets, allowing them to be analysed efficiently.
KQL is the primary tool used to query Application Insights Logs, however, it’s useful to know that KQL is not limited to this purpose. KQL can be used to query data from other Azure platforms, including Azure Log Analytics and Microsoft Defender for Cloud.
By the end of this article, you will be comfortable with writing basic KQL queries to retrieve data from Application Insights Logs and you can use this same knowledge to extract useful information from other Azure platforms too.
Demo data access
Microsoft helpfully offers demo platforms that can help you to learn KQL in a safe environment.
You can click here to access the Application Insights demo data in the Azure portal where you’ll see a user interface that is similar to the screenshot below.
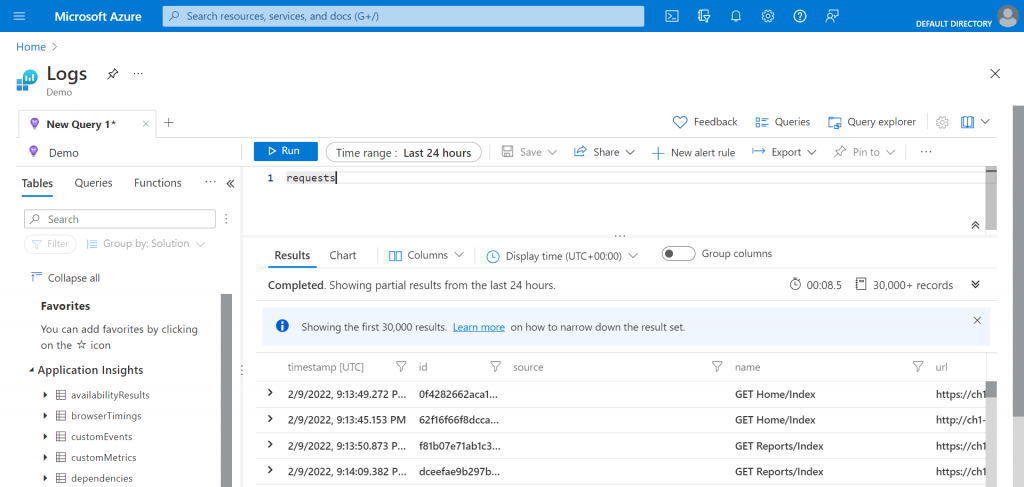
The Application Insights Logs user interface is fairly intuitive. There is the main query text area where you can enter query text and a ‘Run’ button above this that allows you to execute your queries. Query results are displayed below the query text area after you execute a query. On the left, there is a collection of tables and you can expand each table node to view the columns contained within each table.
I recommend that you use the demo portal to follow along as you read the remainder of this article. You can copy and paste the queries found in the following sections into the query text area and run them to see the results.
All you need is a free Microsoft account to access the demo portal and start working on your KQL skills.
Queries
Let’s get stuck into some queries. I’ll be covering the query operators that I believe will be most helpful for getting started with analysing Application Insights Logs. I’ll be focusing mostly on the ‘requests’ table as it tends to be the most frequently queried table for Application Insights.
To start with, KQL queries can be as simple as the following (enter this into the query text area in Azure and press the ‘Run’ button).
requests
The above query will return all records from the ‘requests’ table (limited to 30,000 by default).
Note that by default the query results are shown for the ‘Last 24 hours’ as indicated by the ‘Time range’ control located to the right of the ‘Run’ button within the user interface. You can change this period by either changing the selected value of the ‘Time range’ control or by setting a custom date/time range within your query (we’ll see an example of this shortly).
Let’s look at some more practical examples next.
Filtering
When you are running queries on any data, one of the most common things you’ll want to do is filter the results based on some criteria. KQL provides the where operator for this purpose.
Example filter query
Here’s a nice first example of a basic request filtering query that you can use and build upon.
requests
| where name has "reports/index"
and timestamp between (datetime(2022-02-08) .. datetime(2022-02-09))
Let’s break down the structure of this query to make it easier to understand the other queries we’re going to cover.
The pipe (|) character is used to pipe the ‘requests’ table output to the where operator.
In the where condition, the name of the column to filter on (name in this example) is specified, followed by the has operator and the value to look for.
Note that the has operator looks for a specific word, so it offers better performance compared to the contains operator which can be used if a substring match is required (e.g. contains "reports/in"). Also, the has operator is case-insensitive. You can use has_cs instead for case-sensitive filtering (the _cs postfix applies to several other operators too).
Conditions can be chained together using the and/or keywords. In this case, another condition has been added to filter on the ‘timestamp’ column for requests that are between the specified datetime values.
Round brackets are used to surround the datetime values. As we’re using the between keyword, the values are separated by .. characters.
Note that you may need to adjust the datetime values to more recent ones in order to get some results from the demo portal.
Since a specific date/time range has been specified in the query you’ll notice that the ‘Time range’ control above the query text area in Azure now says ‘Set in query’. Quite a clever little addition I think you’ll agree!
More conditions
Now that we understand how a query is put together, let’s look at a couple more filtering examples.
requests
| where timestamp >= ago(1hr)
and (client_City == "London" or client_City == "Paris")
In the above example, the ago function is used to restrict the results to requests that have been made in the last hour and where the client city is either London or Paris.
You can use a combination of and/or operators and round brackets to build up highly complex conditions like you would with a traditional SQL query.
Filtering on multiple columns
Here’s an example of how to search for data across multiple columns.
requests
| where * hassuffix "index"
The above query is filtering on records where the value of any column in the ‘requests’ table ends with the text ‘index’.
The usage of the asterisk (*) character to search all columns of a table allows the where operator to mimic the behaviour of the search operator, which we’ll cover next.
Searching
If you don’t need to do any conditional checks and only need to search your tables for specific text or patterns of text, you can use the search operator instead of where.
requests
| search "reports"
The above query will search for the text ‘reports’ in every column of every row of the ‘requests’ table. Although it’s not the most efficient option, the search operator offers a quick and simple way of finding text.
To make the search case-sensitive we can update the query slightly using the kind modifier, as follows.
requests
| search kind=case_sensitive "reports"
Instead of searching all columns, you can restrict the search to a specific column by including the name of the column to search followed by a colon (:) character, as shown below.
requests
| search name:"reports"
You can also search for text in multiple tables, like so.
search in (requests, traces) "reports" or "home"
Note the use of the logical or operator in the above example. As per some of the where examples shown previously, you can build up more complex and/or conditions where required.
There are many other things you can do with search (and where) such as including wildcards in your search terms (e.g. "*reports*") and you can avail of several other operators such as startswith or endswith.
Check out the String operators page on the Microsoft Docs website which lists all of the available KQL string operators for reference. You’ll notice that on the left of the page there are links to additional pages that document other operators types such as numerical operators and logical operators.
Sorting and limiting
In addition to filtering results and searching for text, sorting and limiting results are common operations you’ll need to learn to use KQL effectively.
Here’s an example of how to sort and limit data.
requests
| sort by timestamp desc
| take 10
The above query uses the sort operator to sort requests by the ‘timestamp’ column in descending order i.e. the most recent request will appear at the top of the results.
Note that you can also use the order operator instead which is an alias providing the same behaviour as sort.
The take operator is used to limit the number of records returned by the query, in this case, the results are limited to 10 records. Limiting results is especially useful for speeding up query execution time so that you can check that your query is valid. You can then remove the limit in order to obtain the complete result set.
It’s important to know that the take operator does not guarantee that the same records will be returned each time you run a query. Therefore, it’s important to sort the data first if you’re using the take operator for anything other than query testing purposes.
Note that you can also use the limit operator instead which is an alias providing the same behaviour as take.
Another way of achieving the same results as the query further above is to use the top operator.
requests
| top 10 by timestamp desc
The top operator conveniently allows you to specify the sort/order criteria and the direction to sort the values in.
As per the previous query, this query will return the top 10 records in order of the most recent timestamp values.
Counting
To count data using KQL, all you need to do is pipe your overall query to the count operator and it will return the total number of records that match your conditions.
requests
| where resultCode == "404"
| count
The above query filters on requests with a 404 (Not Found) result code and then displays the total number of records, rather than a list of request records.
Queries like this can be useful in various scenarios. For example, if you want to track if specific types of errors, warnings, or other events are occurring on a regular basis.
Projecting
By default, when you execute queries, the full set of columns from the tables you are querying are returned in the result set.
It can be very useful to restrict the list of columns to just the ones that you are interested in.
Here’s an example of how to achieve this using the project operator.
requests
| where timestamp >= ago(1hr)
| sort by timestamp
| project timestamp,
          url,
          resultCode,
          duration
By specifying only a particular set of columns, we are making the query more efficient and there’s also no need to scroll back and forward so much on the user interface to see the information that we are truly interested in.
If you want to specify a list of columns that should not be included in the output, simply replace the project keyword with project-away.
Joining
Inevitably there will be situations where you need to join records from one table to another.
When analysing Application Insights Logs, a good example of this is when you are querying the ‘traces’ table and you need to know what the URL relating to the trace record is. Perhaps your web application uses a separate sub-domain for each of your tenants and you want to filter on the url column to identify traces for a specific tenant.
traces
| join requests on operation_Id
| where operation_Name has "home/index"
and url startswith "https://ch1-retailappy37ha6"
In the above query, the join operator is used to join the ‘requests’ table to the ‘traces’ table on the value of the ‘operation_Id’ column.
Note that the default join operation is ‘inner unique’. This behaviour can be customised as follows: join kind=inner requests on operation_Id
The where operator is used to filter the results based on the value of the ‘operation_Name’ column in the ‘traces’ table.
Another condition is added to check that the URL starts with the specified text.
Note that url is a column in the requests table.
Check out the join operator page on the Microsoft Docs website to learn more about joins.
Additional learning
There’s so much more that I could cover in this article. However, my aim has been to provide simple and practical examples of the most frequently used query operators to help you get started.
As per the order of the content in this article, I recommend that you start off with using the where operator to filter records from the ‘requests’ table. You can then experiment further by adding other operators to the first example query to build something more complex.
Some other operators that I would encourage you to check out next include the following.
And of course, there are many other operators on top of these that you’ll want to explore!
For a deep dive, check out the official Microsoft Docs where the Kusto Query Language is fully documented.
This Quick Reference page within the Microsoft Docs is a very useful resource when you are writing KQL queries.
Summary
In this article, I have focused on examples of common types of queries you will want to run when analysing your Application Insights Logs in Azure.
I started off by briefly explaining what KQL is and how to access a demo portal where you can start learning it.
I then walked through a number of examples of how to filter data, search, sort, project, and more.
Lastly, I provided links to useful resources where you can continue your journey to learn KQL in greater depth.
Comments
Seamus
> Since a specific date/time range has been specified in the query you’ll notice that the ‘Time range’ control above the query text area in Azure now says ‘Set in query’. Quite a clever little addition I think you’ll agree!
July 29, 2023This is great until you realize that even if you try to filter by birthdate of person filed in logs, it still changes to “Set in Query”, and tries to get all the terabytes of logs instead of getting logs for last 4hrs.
Weird.
Jonathan Crozier
Hey Seamus, that does sound weird if I understand you correctly. Is the behaviour you have described something you’re able to replicate in the demo portal?
August 2, 2023