
Azure Application Insights is a powerful monitoring feature within the Azure cloud platform that can provide you with some pretty amazing insights into your web applications.
By default, Application Insights captures a plethora of highly useful data points regarding both performance and user behaviour. The analysis of these metrics can assist you with speeding up your application and improving the overall user experience.
However, sometimes the standard set of data which is captured by Application Insights isn’t enough and you may find the need to enrich the data further with your own metrics and user-defined properties.
In this article, I walk through the basics of how Application Insights works in Azure and then proceed to demonstrate how you can further enhance the data it captures with your own custom telemetry.
What is Application Insights?
In the Microsoft Docs Azure Application Insights is described as follows.
Application Insights, a feature of Azure Monitor, is an extensible Application Performance Management (APM) service for developers and DevOps professionals.
Fundamentally, Application Insights is a tool that you can leverage to monitor your application.
It is a service that captures data from your web application, including request data, performance counters and also any custom metrics or logs that you wish to record. It’s a complete framework that you can use to analyse and subsequently improve your web applications.
Initially, you’ll most likely want to focus on the request data that Application Insights provides. This includes the tracking of requests rates, response times and failures. You can then correlate this data with information from other sources such as the CPU and memory usage of your web server.
Application Insights is also a great place to store your application logs. By storing your logs within Application Insights you will have all of your key data in one place and can cross-reference various events.
Enabling Application Insights
Whenever you’re just starting out with Application Insights, the easiest way to get up and running quickly is to enable the Application Insights extension within Azure.
It is currently possible to do this if you are using an Azure App Service to host your web application and it only takes a few button clicks within the Azure portal to set it up.
This a great option if you are early in the development of your application and your primary motivation for using an Application Performance Management service, such as Application Insights, is to monitor the volume of requests hitting your application and to check your application for errors.
It also means that you do not need to introduce a dependency on the Application Insights SDK into your application code.
Note that the option to turn on the Application Insights site extension is only available if you are using a Windows-based App Service Plan. Linux-based App Service Plans do not currently support a ‘codeless’ Application Insights configuration. Your application also needs to be targeting either .NET or .NET Core.
To enable the Application Insights site extension within the Azure portal, open up your App Service and then navigate to the Application Insights section, as shown in the screenshot below.
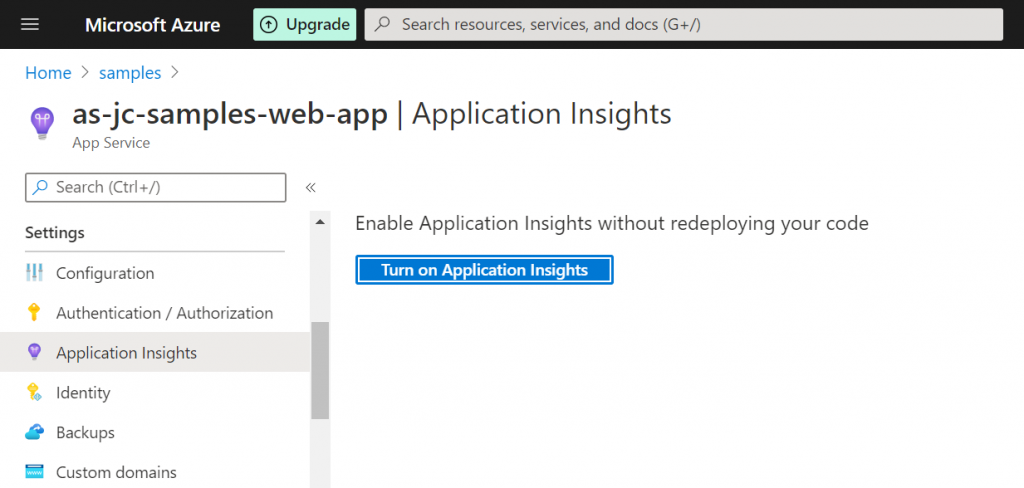
As you can see from the message within the screenshot, there is no need to redeploy your code whenever Application Insights is enabled from the Azure portal.
Go ahead and click the ‘Turn on Application Insights’ button.
You will then be presented with the Application Insights configuration page.
A resource name is required and I recommend prefixing this (e.g. with the text ‘ai’) to help identify the resource as an instance of Application Insights.
By default, the UI will have the ‘Recommended’ value selected for the ‘Collection level’ setting.
Personally, I suggest starting off with ‘Basic’ instead, without the ‘Profiler’ or the ‘Snapshot debugger’ enabled. It is important to be aware that although powerful, these features have the potential to drastically slow down your application unless you have a beefy App Service Plan.
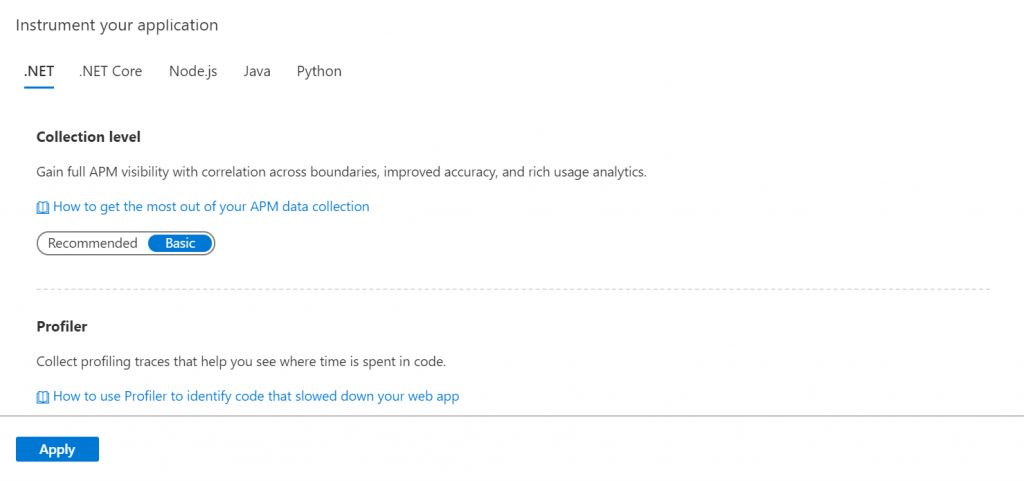
Typically whenever you use the ‘Basic’ option, you should barely notice any performance impact on your application, as per the Microsoft Docs:-
“The impact on your app’s performance is small. Tracking calls are non-blocking, and are batched and sent in a separate thread.”
Before continuing, be sure to check you are on the correct tab for your application framework i.e. .NET/.NET Core.
Now click the ‘Apply’ button and then the ‘Yes’ button to confirm you wish to go ahead with the installation of the tools and the restart of your App Service.
After the deployment has completed, switch over to your App Service and view your Application Settings within the ‘Configuration’ section. You will see that lots of new settings have been automatically created and configured for you.
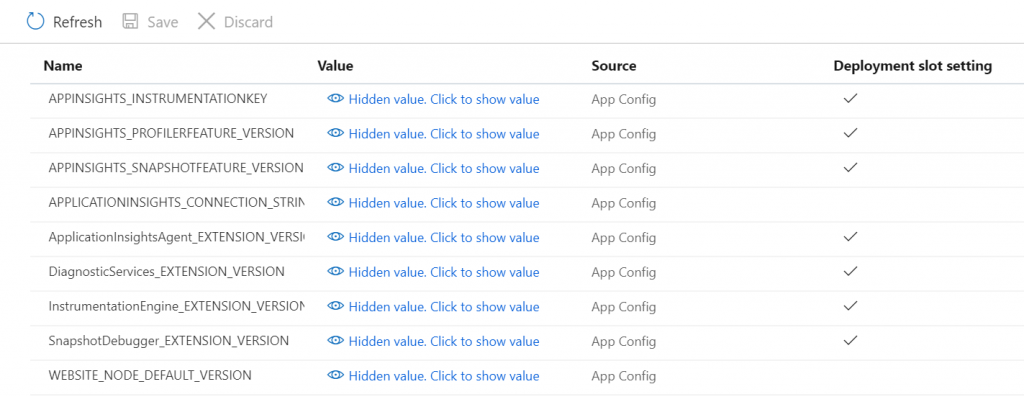
The most important setting is named ‘APPINSIGHTS_INSTRUMENTATIONKEY’. This is used to identify the Application Insights resource where your application data should be sent to.
At this point, everything has been configured automatically as part of enabling the Application Insights site extension. Application Insights is now live and will track all requests made to your application.
Now is a good time to test that everything has been hooked up correctly. Start off by making a few requests to your application. This could be as simple as visiting the home page and refreshing the browser a few times.
If you go back to the Application Insights resource, within a minute or two you should see the requests showing up in the default ‘Server requests’ graph which appears on the ‘Overview’ section of the Application Insights resource.
Custom telemetry
While the data that Application Insights captures by default is quite extensive, there are occasions where you will find the need to enrich it further with your own telemetry.
This can be accomplished with Telemetry Initializers.
Telemetry Initializers
In order to record custom data in Application Insights, we must create a ‘Telemetry Initializer’ class within our application code which implements the ITelemetryInitializer interface.
Whenever we find the need to log custom telemetry for our App Service, we need to start working with the Application Insights SDK; the codeless solution isn’t going to cut it anymore.
There are a couple of ways to add the Application Insights SDK into an ASP.NET application.
For example, within Visual Studio you can use the ‘Connected Services’ node to add a dependency on Azure Application Insights. The setup wizard will even allow you to select the Application Insights resource you are linking to.
Alternatively, you can simply install the appropriate Application Insights NuGet package.
After installing the NuGet package you will notice that an ApplicationInsights.config file has been created. This file will be ignored if you already have the Azure Application Insights site extension configured for your App Service.
The NuGet package installation process also adds a few lines to your Web.config file to register modules and configure binding redirects.
Custom telemetry code
Now that the Application Insights SDK is installed we can create a custom Telemetry Initializer.
You can create a new class in your project as follows and customise it to meet your requirements.
/// <summary>
/// Configures custom telemetry logic.
/// </summary>
public class CustomTelemetryInitializer : ITelemetryInitializer
{
    #region Methods

    /// <summary>
    /// Initialises the properties of the telemetry with custom data for each request.
    /// </summary>
    /// <param name="telemetry"><see cref="ITelemetry"/></param>
    public void Initialize(ITelemetry telemetry)
    {
        // Get the request telemetry.
        var requestTelemetry = telemetry as RequestTelemetry;

        if (requestTelemetry == null)
        {
            // If the standard (or any custom) telemetry modules did not issue a 'TrackRequest', return.
            return;
        }

        // Example of setting a standard Context telemetry property.
        requestTelemetry.Context.User.AuthenticatedUserId = "Jonathan";

        // Example of setting a custom telemetry property.
        requestTelemetry.Properties["customData"] = "custom value";
    }

    #endregion
}
In the sample code above, we first of all check that there is a telemetry object to work with.
The code then sets a value for one of the standard Application Insights metrics which can be accessed via the Context property. There are quite a few standard metrics and whatever value is set for these within a custom Telemetry Initializer will override the value that would normally be captured automatically.
Finally, the Properties Dictionary is used to store some custom data which can be set to whatever is required. We could retrieve some information from a database at this point, pull out a value from a JWT token or perform some other custom action in order to determine the required value.
The only other thing we need to do now is to register the custom Telemetry Initializer.
In an ASP.NET application, this can be accomplished by adding the following line of code to the Application_Start method of the Global.asax.cs file.
TelemetryConfiguration.Active.TelemetryInitializers.Add(new CustomTelemetryInitializer());
At this point, you can deploy the changes to Azure and issue some requests to your web application.
Note that it will take a minute or two for your requests to become available for reporting on within Application Insights.
Analysing custom telemetry
Now you can run queries on your Application Insights logs and filter the results as required.
To do this open up your Application Insights resource in Azure and click on the ‘Logs’ button.
Close the ‘Example queries’ dialog if it appears.
Now type the text requests into the query window and press the ‘Run’ button.
By default, the columns for the custom data we are recording are not displayed in the Results pane. Click on the ‘Columns’ drop-down and tick on the ‘user_AuthenticatedId’ and the ‘customDimensions’ checkboxes.
Now scroll across the Results grid and you should be able to see the columns. You can reposition the columns within the grid as per the screenshot below.
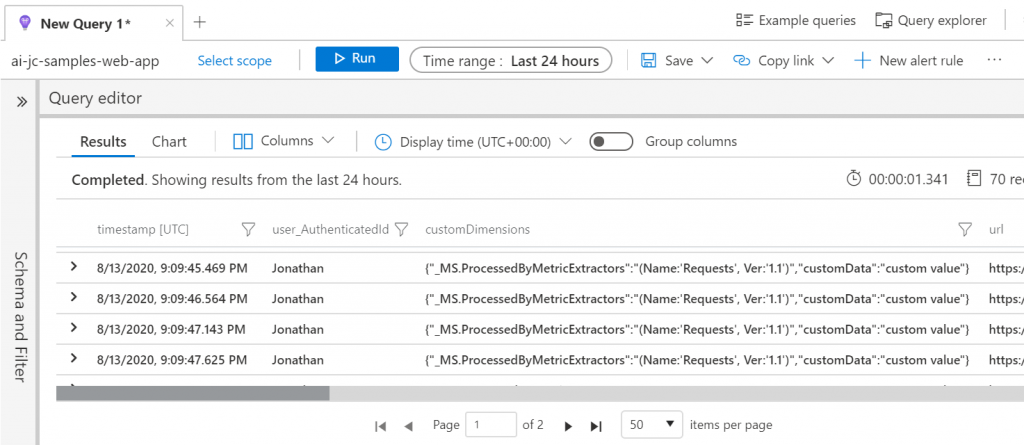
As you can see from the above screenshot our custom value for the ‘user_AuthenticatedId’ property has been filled in and it is easily visible within a standard column in the Results grid.
Our custom value for the ‘customData’ key/property appears within the ‘customDimensions’ column.
Thankfully, it is very straightforward to filter on custom data. For example, we could update our simple requests query to the following instead to only show requests where the ‘customData’ property has been set to ‘custom value’.
requests | where customDimensions.customData == 'custom value'
The ability to store and report on as many ‘custom dimensions’ as needed is very powerful and makes Application Insights highly extensible.
Summary
Application Insights is a very powerful and useful tool for monitoring web applications.
We learned that although the standard set of data captured by Application Insights is pretty comprehensive, sometimes there is a need to extend it further with our own custom data.
Having the ability to enhance the data which Application Insights captures with our own custom telemetry makes Application Insights a truly versatile platform for monitoring web applications. This means that you can go forward with confidence that you will be able to extend your monitoring further in the future whenever new requirements arise.
I hope this helps you to get up and running quickly with Application Insights and enables you to see how much scope there is for customising the data that it captures to meet your needs.


Comments