

While developing a Windows Service, it is important to be able to debug it like you would a regular desktop or web application.
Debugging Windows Services isn’t quite as straightforward as debugging standard Windows, Console, or Web applications. However, when developing a .NET Windows Service it isn’t difficult to set up your project to support debugging and there are a few different options available to achieve this.
This article focuses on the options for debugging a Windows Service while you are developing it using Visual Studio, as opposed to when the service is running on a production system.
In the sections that follow I cover a number of different options that will enable you to hit breakpoints in your Windows Service application code.
Windows Service basics
To start with, it is important to understand how Windows Services operate in regards to hosting.
Windows Services must be run within the context of the Services Control Manager.
The Service Control Manager hosts and manages the execution of Windows Services. Among other things it allows services to be stopped and started, both manually and automatically.
Service registration
When developing a Windows Service using C#, as per most .NET applications you will notice that there is still a static Main method that acts as the program entry point.
The key difference from a normal application is that the first thing that typically happens in the Main method is the registration of the service (or services) that you want to run within the context of the Service Control Manager.
This is shown in the code sample below.
/// <summary>
/// The main entry point for the application.
/// </summary>
static void Main()
{
    var servicesToRun = new ServiceBase[]
    {
        new MyService()
    };

    ServiceBase.Run(servicesToRun);
}
The body of the Main method can be simplified further from the default .NET Windows Service template code, if you are only registering one service, as per the code below.
var service = new MyService();
ServiceBase.Run(service);
After the code calls the Run method, a dialog box similar to the following will appear.
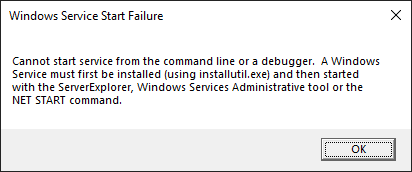
The above message indicates that you can’t start the service unless it has been installed. This means that by default you can’t debug the service from Visual Studio as you would a normal application.
To start a Windows Service you first need to install it using a service installation utility. However, this typically isn’t required when you are still in the development phase of your project.
Service installation
Before moving on to the next section, if you do want to install your Windows Service there are two main options.
InstallUtil
Firstly, you can use InstallUtil, as recommended by the dialog box message shown further above.
InstallUtil "C:\Path To My Service Project\bin\Debug\MyService.exe"
To uninstall an existing service, just insert the /u or /uninstall switch into the command, as follows.
InstallUtil /u "C:\Path To My Service Project\bin\Debug\MyService.exe"
InstallUtil can be accessed as above when using the Developer Command Prompt for Visual Studio, or if you have added the program to your Path.
The InstallUtil executable is usually found at the following location.
C:\Windows\Microsoft.NET\Framework\v4.0.30319\InstallUtil.exe
SC utility
Alternatively, you can use the standard sc utility from the command line which is available as standard on practically any modern Windows device.
sc create MyService binPath="C:\Path To My Service Project\bin\Debug\MyService.exe"
To uninstall a service specify delete instead of create within your command.
sc delete MyService
The sc utility works just fine for simple service install and uninstall requirements.
Debugging approaches
Now let’s look at some of the debugging approaches that we can take.
Debug service method
Probably the easiest option for adding debugging support to a Windows Service is to create a debugging entry point method in the service class we have implemented.
We can then control access to the debugging entry point via a conditional compiler pragma check.
Below is an example of how the updated body of the Main method would look using this approach.
var service = new MyService();

#if DEBUG

// Debug the Windows Service.
service.OnDebug();
Thread.Sleep(Timeout.Infinite);

#else

// Run the Windows Service.
ServiceBase.Run(service);

#endif
Note the code highlighted in grey. This indicates code that is not compiled for the current solution configuration.
The above code first of all creates a new instance of our service object.
If the DEBUG constant is defined, which it will be by default for the ‘Debug’ solution configuration, then the OnDebug method will be called. Underneath, the OnDebug method calls the OnStart method on the service object.
Lastly, the Sleep method call waits for an infinite amount of time, allowing the service code to continue execution until debugging has been stopped.
The OnDebug method within the service class is implemented as follows.
/// <summary>
/// Entry point into the service to allow for debugging.
/// </summary>
internal void OnDebug()
{
    OnStart();
}
As you can see, the OnDebug method simply calls the OnStart method to kick off our service.
The OnStart method is defined as follows.
/// <summary>
/// Executes when a Start command is sent to the service.
/// </summary>
/// <param name="args">Data passed by the start command</param>
protected override void OnStart(string[] args = null)
{
    Debug.WriteLine("Service started!");
}
The args parameter has been updated with a default value of null to allow the OnStart method to be called without any arguments being passed to it.
Of course, in a real-world scenario, the body of the OnStart method will usually be much more interesting than the basic WriteLine method call shown in the above example.
Now that you have a debugging entry point you can add a breakpoint to your Main, OnDebug, or OnStart method to commence your debugging session from there.
Conditional attribute check
If you don’t like inline compiler pragmas, you may instead consider using the Conditional attribute.
With this approach, we can swap out the #if, #else, and #endif pragma checks for regular if and else conditional statements.
// Check if we are debugging.
bool debugMode = false;
CheckDebugMode(ref debugMode);

if (debugMode)
{
    // Debug the Windows Service.
    service.OnDebug();
    Thread.Sleep(Timeout.Infinite);
}
else
{
    // Run the Windows Service.
    ServiceBase.Run(service);
}
The key part of the above code is the call to the CheckDebugMode method, which is defined as follows.
/// <summary>
/// Checks if debug mode should be enabled.
/// </summary>
/// <param name="debugMode">The debug mode to set according to the current solution configuration</param>
[Conditional("DEBUG")]
private static void CheckDebugMode(ref bool debugMode)
{
    debugMode = true;
}
The CheckDebugMode method is decorated with the Conditional attribute. This means that the CheckDebugMode method will only be executed if the DEBUG constant is defined.
There are a number of restrictions placed on methods that use the Conditional attribute. For example, they must return void and cannot contain out parameters, hence the somewhat verbose method definition.
However, this approach does have benefits over the compiler pragmas since you can always verify that your code is currently compiling regardless of what your selected solution configuration is e.g. ‘Debug’ or ‘Release’.
User interactive mode check
A slight variation on the previous approaches is to check if the current process is running in user interactive mode, rather than relying on compiler constants.
var service = new MyService();

if (Environment.UserInteractive)
{
    // Debug the Windows Service.
    service.OnDebug();
    Thread.Sleep(Timeout.Infinite);
}
else
{
    // Run the Windows Service.
    ServiceBase.Run(service);
}
The UserInteractive property will return false when a process is running within a host that does not allow user interface components to be displayed.
Examples of this include IIS processes and Windows Service processes which are not allowed to show any UI by default.
This code is much simpler than the compiler pragmas and Conditional attributes.
Please note, however, that this approach may not be desirable if you do not want your application to be runnable in production outside the context of the Service Control Manager. The above code will allow your application to be run manually by simply ‘double-clicking’ the compiled service executable.
Attach to Process
It is possible to attach the Visual Studio debugger to a running Windows Service.
This can be beneficial when you are nearing the end of development work on your project and you want to test that your application is operating correctly when it is running as a bonafide Windows Service.
It is also useful if you are experiencing issues in production that can only be reproduced when your Windows Service is running within the context of the Service Control Manager.
Before continuing, it is important to note that in order to get meaningful information when debugging you’ll need to attach to a Debug build of your Windows Service that includes the debug symbol (.pdb) files.
To debug a running Windows Service, first of all, make sure that your service has been started.
Then from the toolbar at the top of Visual Studio select Debug –> Attach to Process…
This will launch the ‘Attach to Process’ dialog, as per the screenshot below.
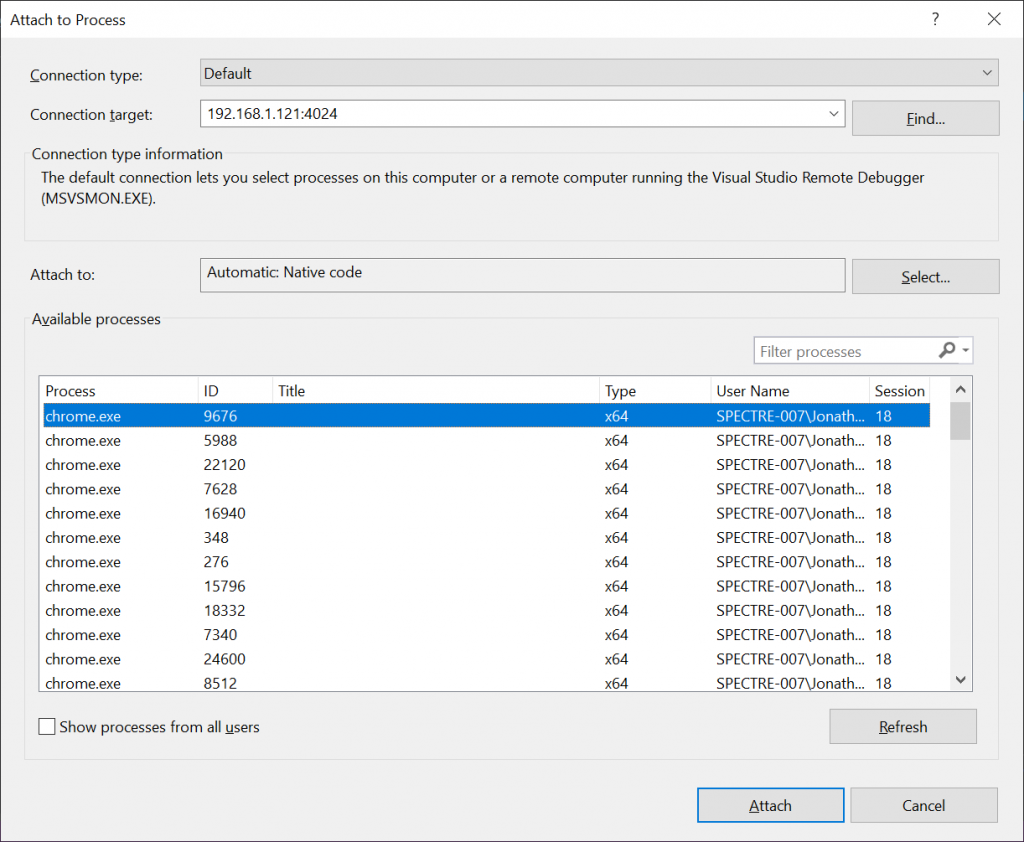
Since Windows Services typically run as one of the built-in Windows accounts, tick the ‘Show processes from all users’ checkbox at the bottom-left of the ‘Attach to Process’ dialog.
Now find the service process you wish to connect to within the ‘Available processes’ list, select it, then press the ‘Attach’ button.
The debugger should now be attached to the process and your breakpoints should be hit as they normally would.
Summary
In summary, I have explained how Windows Services are hosted by the Service Control Manager, making them less straightforward to debug compared to standard Windows and Console applications.
I have covered how to install Windows Services using either the InstallUtil or sc utilities.
Lastly, I have demonstrated a few different ways in which you can add support for debugging Windows Services from Visual Studio.
Let me know what your favourite approach is in the comments!
Comments
Eli
You don’t need all the above complications, just add Debugger.Launch() method to the Service….
May 1, 2023Jonathan Crozier
Thanks, Eli. That would be useful for cases where you want to attach the debugger when the program is actually running as a Windows Service, as a result of starting it from the Services window or via the
May 1, 2023net startcommand.