

Once your applications are running in a production environment, it is important to be able to monitor what is happening under the hood.
Quite often this is achieved by logging output to a file, to a database, or to some other medium. However, it is also possible to intercept live debug and trace output using specialised monitoring tools.
This article covers how to capture the output from Windows applications that use standard debug output APIs via a tool called DebugView.
What is DebugView?
DebugView is a small Windows program that allows you to capture debug and trace output from running applications.
It is another highly useful ‘SysInternals’ tool developed by Mark Russinovich.
In addition to capturing output from applications that are running locally, DebugView can capture output remotely across a network. With the correct permissions, DebugView can also capture Global Win32 and Kernel output.
A big advantage of DebugView is that it is lightweight. It can be downloaded and run immediately on any Windows system without installation and without needing your development debugger to be set up in order to view debug output.
By using standard debug output APIs, you don’t need a database or permissions to a log file directory to add logging to your application.
For certain applications, in addition to my main logging strategy, I find it useful to trace when the application has started and when unhandled exceptions occur. This can help in cases where there is a misconfiguration or some other problem with the main logging setup.
Running DebugView
There are two main ways to get DebugView running on a Windows machine.
Option 1
The most common way is to head over to the Microsoft Docs SysInternals page and click on the ‘Download DebugView’ link to download DebugView as a zip file.
Once the download has completed you can open up the zip file and launch ‘Dbgview.exe’ directly. This is useful if you are only planning to keep DebugView on the machine temporarily. If you intend to keep DebugView on the machine for longer you can extract the contents of the zip file to a dedicated folder and launch the program from there.
Option 2
The second way of running DebugView is to launch it by clicking on the ‘Sysinternals Live’ link on the same Microsoft Docs SysInternals page mentioned above.
In addition to the HTTP link, you can run DebugView directly via the following file share.
\\live.sysinternals.com\tools\Dbgview.exe
After entering the above path into either the Run dialog or File Explorer, you’ll need to press the ‘Run’ button within the ‘Open File – Security Warning’ dialog in order to allow the program to launch.
It usually takes a few seconds for the program to launch when using this approach.
The advantage of the live link is that there is no need to download any files onto the machine that you want to run DebugView on.
Basic usage
After launching DebugView, the main program window will appear.
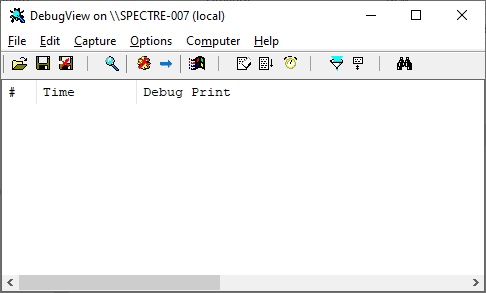
The user interface is quite simple with a toolbar, buttons with icons to access common functions, and a list-view that displays debug output from running applications.
Now let’s see how we can capture some debug output. Various well-known Windows programs output debug information, such as Visual Studio.
Below is a screenshot that demonstrates what some of the debug messages from Visual Studio 2019 look like in DebugView.
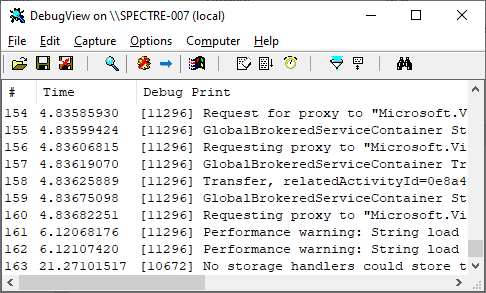
By default, DebugView starts capturing debug output as soon as it is launched.
The list-view displays the line number, time, and the debug print message. Each message is prefixed with the Process ID of the related application inside square brackets for reference.
Additional features
DebugView has a number of additional features, some of which I will cover below.
Log file output
One of the most useful features of DebugView is its ability to save the output to a log file.
To configure this, within DebugView click on File –> Log to File…
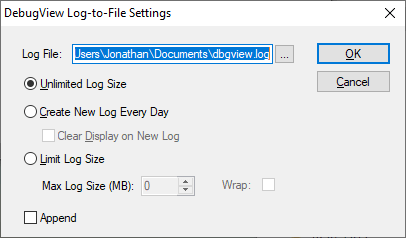
Within the dialog that appears, choose the ‘Log File’ path to where you would like to save the logs.
There are additional options that allow you to create a new log file every day and you can limit the size of the log file too.
After clicking the OK button, DebugView will begin saving the output to the specified log file.
This feature is very useful whenever you want to set up monitoring for an application to run in the background and then review the logs at a later point in time. You can open and view saved log files directly within DebugView.
Remote connections
As mentioned earlier, it is also possible to connect to a remote machine and view its debug output.
To set up a remote connection, within DebugView click on Computer –> Connect…
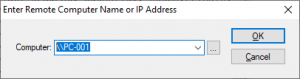
Within the dialog that appears, enter the name or IP address of the computer you wish to connect to.
You’ll need to supply the appropriate credentials for the computer you are connecting to.
Now you’ll be able to view live debug output from the remote machine. Pretty neat!
Other features
There are a number of other helpful features such as the ‘Find’ function which allows you to search the debug messages for keywords and there is the ability to filter and highlight output.
I encourage you to have a play around and see what else you can do with the tool.
Writing debug output from code
If you want to write debug output from your own applications, this is straightforward to do with most languages and frameworks.
For example, if you are using C# with the .NET framework you can add the following using statement to get access to the standard debug output APIs.
using System.Diagnostics;
This allows you to write debug output as follows, without specifying the fully qualified namespace.
Debug.WriteLine("My Debug message.");
The above code will output the specified message when your program is running with a Debug build configuration.
For applications running in Release mode, the Trace API can be used as follows.
Trace.WriteLine("My Trace message.");
The specified message will be output for both Debug and Release builds of the application.
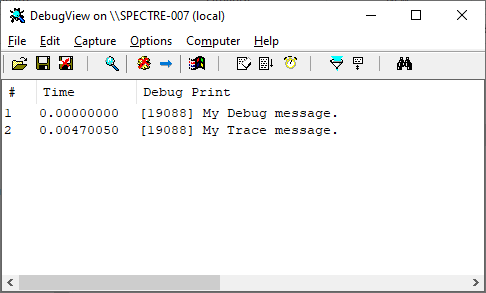
The above screenshot shows the application output when both the Debug and Trace messages are included in a Debug build of the application.
When tracing output, as a best practice, it is typical to format it with additional context information. This makes it easier to identify which application and which machine the output is originating from.
Below is an example of this.
/// <summary>
/// Writes a trace message that can be viewed via a monitoring program such as DebugView.
/// </summary>
/// <param name="message">The message to output</param>
public static void TraceWriteLine(string message)
{
    Trace.WriteLine($"MyApp.Program::Main: {message} @ {Environment.MachineName} " +
                    $"(MyApp.exe Version - {Assembly.GetExecutingAssembly().GetName().Version} - " +
                    $"{Environment.UserDomainName}\\{Environment.UserName})");
}
Note that for performance reasons I recommend that you refactor the code that gets the assembly version to use a static field instead.
The above code will output something like the following.
MyApp.Program::Main: My Trace message. @ SPECTRE-007 (MyApp.exe Version - 1.0.0.0 - SPECTRE-007\Jonathan)
I highly recommend adopting a standard format as shown above if you are intending to include trace output in the release version of your application for monitoring purposes.
Summary
In summary, I have explained what DebugView is and why it is a useful and powerful tool for monitoring running applications.
I’ve covered how to run DebugView on a Windows machine, by either downloading it or running it directly from Sysinternals Live.
I’ve walked through how to capture and view debug output, as well as how to log output to a file and connect to other computers for remote monitoring purposes.
Finally, I’ve provided examples of how to output debug and trace messages from your own applications.
Comments