

Monitoring query performance is an essential aspect of proper database management. Poorly performing queries can produce a domino effect, affecting the overall health of your database server and severely degrading application user experience.
Queries that result in many reads and writes to the hard disk and that use excessive amounts of CPU time and memory can have a detrimental impact on system responsiveness. Such queries are likely to affect not only the database they are executing against but will also influence the performance of other databases located on the same server instance.
In this post, I will provide a query that fetches performance statistics related to other currently running queries on a SQL Server or Azure SQL database server to help you track down rogue queries in real-time.
The Query
Let’s dive straight into the query, which I’ve included in the following subsection.
The query source is also available on my SQL Server Scripts GitHub repository which features several other SQL scripts that you may find helpful.
SQL
The following SQL Server query retrieves useful statistics such as the total elapsed time, total CPU time, and read/write metrics for queries across all databases on the server instance.
-- Example of how to extract performance statistics for currently running queries in a SQL Server instance.
SELECT
    r.session_id AS [Session ID],
    s.database_id AS [Database ID],
    DB_NAME(s.database_id) AS [Database Name],
    r.total_elapsed_time AS [Elapsed Time (ms)],
    r.cpu_time AS [CPU Time (ms)],
    r.writes AS [Writes],
    r.reads AS [Reads],
    r.logical_reads AS [Logical Reads],
    r.[status] AS [Status],
    t.[text] AS [SQL Text]
FROM sys.dm_exec_requests AS r
CROSS APPLY sys.dm_exec_sql_text(r.[sql_handle]) AS t
INNER JOIN sys.dm_exec_sessions AS s ON r.session_id = s.session_id
WHERE r.session_id > 50  -- Exclude system sessions.
ORDER BY r.total_elapsed_time DESC, r.cpu_time DESC
The query fetches information about queries that are actively running or are currently in the process of executing at the time you run the query. It does not show recently executed queries that have already completed their execution.
If you want to set up automated monitoring, check out my SQL Server deadlocks article which covers how to set up a SQL Server Agent Job which logs the output of a SQL query to a file.
Let’s break down how the above query works in the following subsection.
How it works
This DMV (Dynamic Management View) returns information about each query request that is currently executing on the database server. Most of the information returned by the query comes from this view.
This table-valued function returns the text of the SQL batch that is being run via the specified request handle.
This DMV provides details about all active user connections and internal tasks.
CROSS APPLY is used to join each row from sys.dm_exec_requests to its corresponding SQL text.
System sessions are excluded by filtering out session IDs that are greater than 50.
The results are sorted by elapsed and CPU time, helping you to quickly identify time-consuming and resource-intensive queries.
The Results
After executing the query, the results will look similar to the screenshot below. Of course, the actual values will vary according to your particular SQL Server instance.
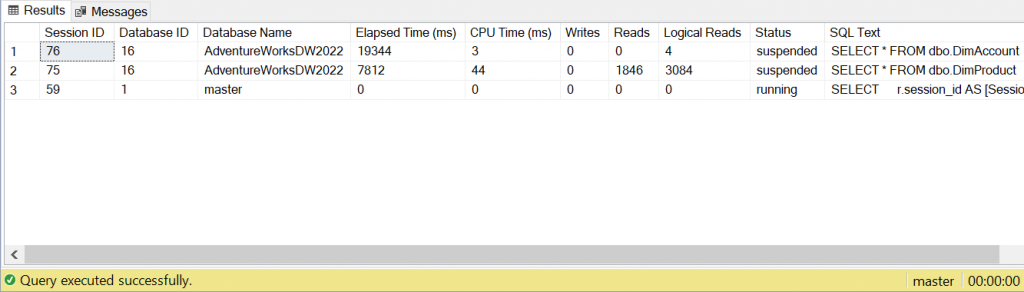
The above results were retrieved from the sample AdventureWorks database, using SQL Server Management Studio to connect to the server and execute the query. The information provided is invaluable when trying to identify slow or resource-intensive queries that may be affecting the performance of your SQL Server instance.
Understanding the results
Next, let me discuss the results and cover what information each column offers us.
Session ID
This is an integer value that represents the unique identifier for the query session.
Database ID
Another integer value that represents the unique identifier for the database where the query is running.
Database Name
The name of the database where the query is running.
Elapsed Time (ms)
The total elapsed time (in milliseconds) from the start of the request. This includes both the CPU time and the time the query spent waiting for resources (like locks).
CPU Time (ms)
The amount of CPU time (in milliseconds) used by the request since it started.
Writes
The number of physical writes performed by the query. This metric counts the number of pages modified and written to disk. SQL Server pages are 8 KB in size.
Reads
The number of physical reads performed by the query. Similar to Writes, this metric counts the number of pages read from disk.
Logical Reads
The number of logical reads from the data cache. Also measured in pages.
Status
The current status of the request. This is a string that can have values like ‘running’, ‘sleeping’, ‘suspended’, etc.
SQL Text
The actual SQL query text that is being executed.
By understanding each of the above metrics, you can gain a deeper insight into query performance and better identify bottlenecks and areas for improvement.
Summary
In this article, I demonstrated how you can use a SQL query to monitor the performance of currently executing queries in a SQL Server database or Azure SQL database.
I included the SQL query listing and explained how it works. I also included an example of the kind of results you can expect to see after executing the query in SQL Server Management Studio. Furthermore, I supplied a breakdown of the information that each metric offers.
By utilizing dynamic management views and functions, we can retrieve real-time statistics that help in identifying bottlenecks and improving overall system performance.
If you want to get more analytical, you can extend the query to pull additional data from the system tables used in the query and/or join more system tables to give you access to other information. If you wish to do this, the documentation for the sys.dm_exec_requests DMV is a great place to start.
Please feel free to check out my SQL Server Scripts GitHub repository and SQL Archives for other helpful SQL scripts.
Comments